
Rank Tracker
See exactly where your products rank for each keyword, track how your optimizations impact visibility over time, and surface the keywords that actually drive sales. Daily updates keep you informed so you can adjust listings, target competitors, and capitalize on ranking momentum.
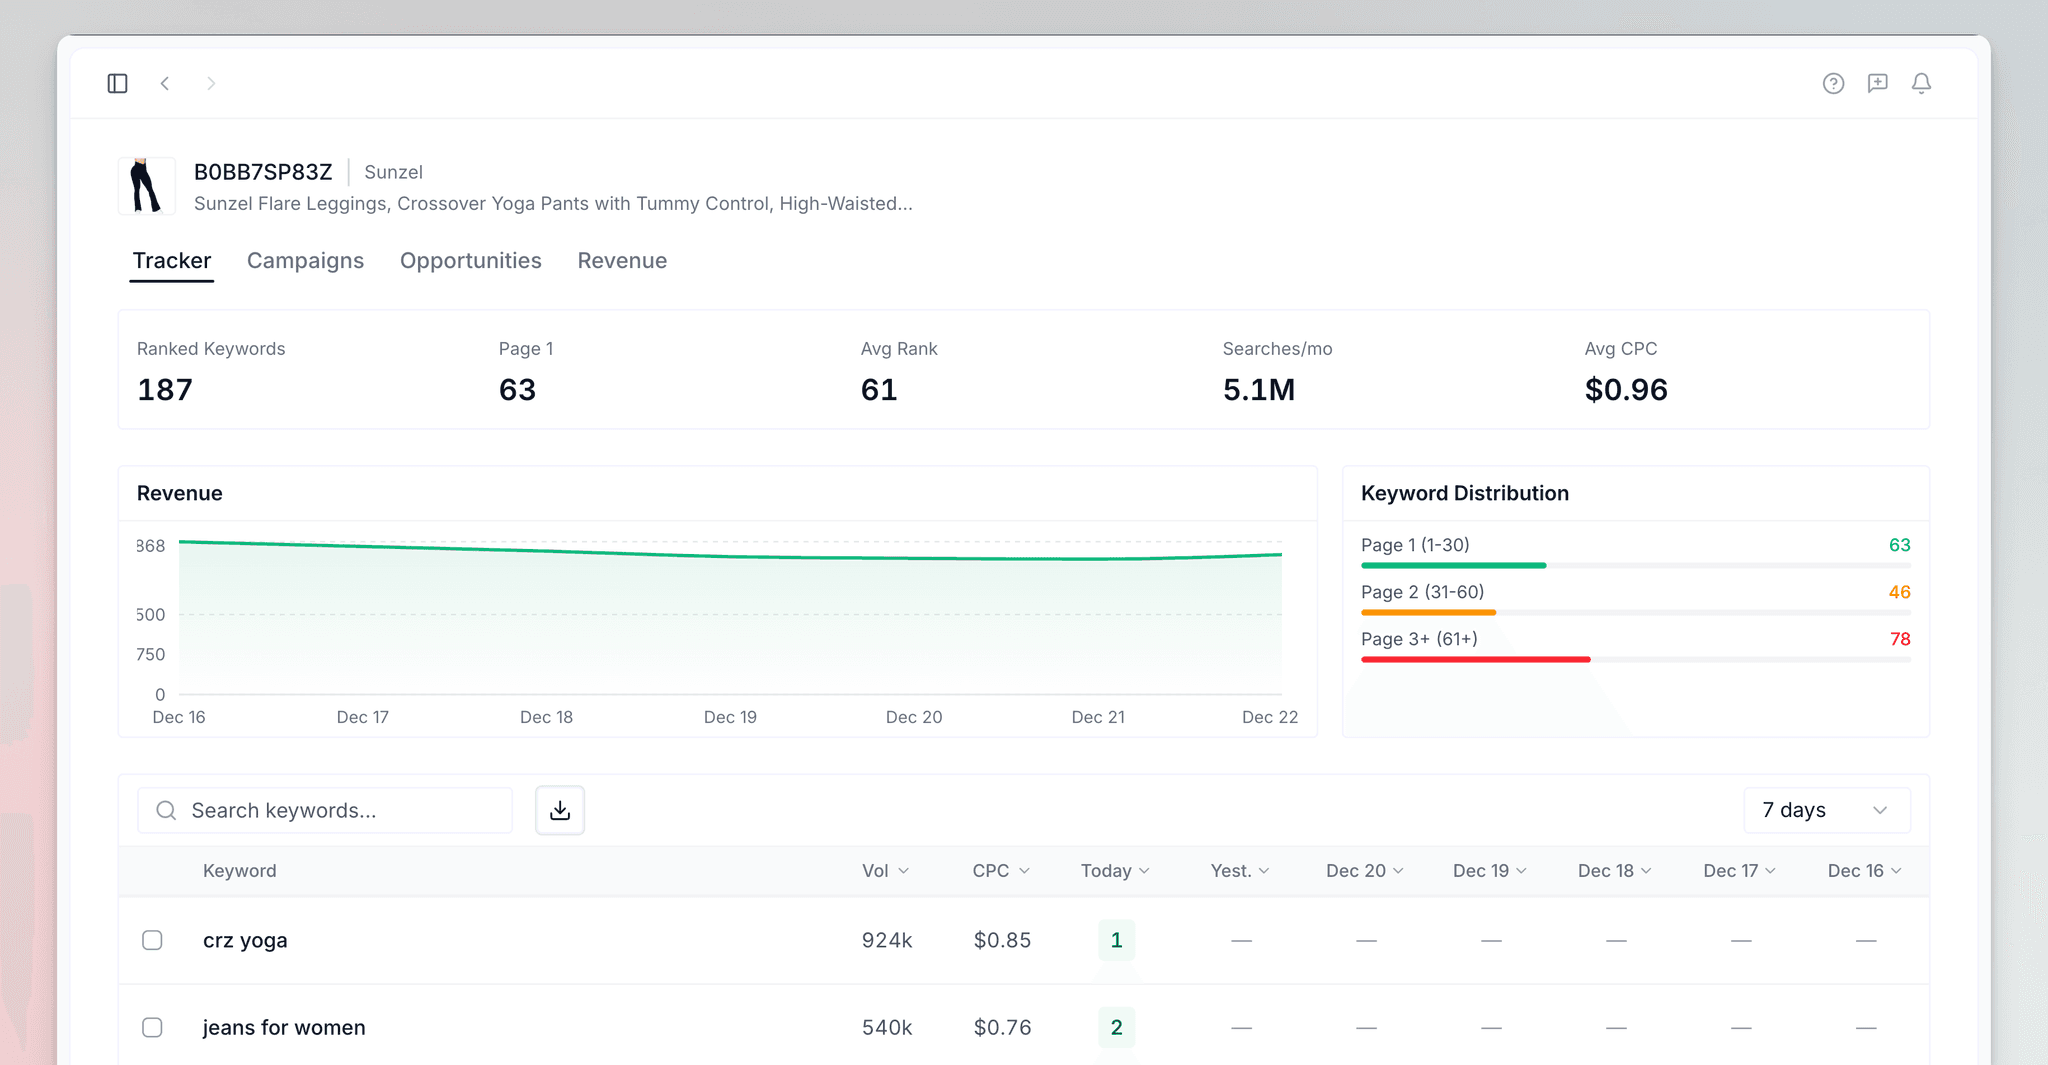
What Is Launch Fast Rank Tracker?
Use Rank Tracker to measure Amazon search visibility and compare keyword movement with sales. Use the results to select terms for listing or PPC work. You can track your own ASINs and competitor ASINs from the same dashboard.
Use it to:
- Track unlimited ASINs and monitor keyword rankings across your entire product catalog
- See daily ranking changes for each keyword your products rank for
- Organize keywords into campaigns for targeted optimization
- Identify high-value opportunities with pre-categorized keyword insights
- Visualize market demand with interactive heatmaps showing purchase volume by keyword
- Get instant notifications when products move 5+ positions or break into page 1
When Does Rank Tracker Update?
Launch Fast updates tracked keyword positions daily. Each update adds a new ranking point so you can compare recent movement across 7-day, 14-day, and 30-day views. You can also select Refresh to get the latest available data.
Notifications highlight keywords that move five or more positions or enter page 1. Review these changes with sales and search-volume data before you change a listing or campaign.
How to Use Amazon Rank Tracker
Access Rank Tracker
Navigate to "Rank Tracker" in the left sidebar to open the tracking dashboard.
Start Tracking
Click the "Track Product" button, then enter your Product ASIN. You can find your ASIN in Seller Central → Inventory.
Wait for Analysis
The Rank Tracker system analyzes the market and retrieves ranking data for your product. This process can take a few moments as it gathers comprehensive keyword data.
View Product Card
When analysis completes, your main Rank Tracker dashboard will update with key information:
- Product Name, Brand Name, and Category
- Monthly Sales and Revenue
- BSR, Ratings, and Review
- Total Ranked Keywords
- Listing Age
Track Additional Products
Click "Track more ASINs" to add more products to your dashboard. Each tracked product displays as a separate card for quick overview access.
Enter Detailed Dashboard
Click a product card to access the full ranking dashboard with 4 specialized tabs: Overview, Campaigns, Opportunities, and Revenue.
New to Launch Fast? Create an account, open the dashboard, and select Rank Tracker in the left sidebar. A separate rank-tracking application is not necessary.
Track your top revenue-generating products first, then add competitor ASINs to understand their keyword strategies and identify gaps in your own approach.
Understanding the Dashboard
Data controls:
- Time period filters: Switch between 7-day, 14-day, and 30-day views to spot trends and patterns
- Manual refresh: Click the Refresh button anytime to get the latest ranking data
- Export CSV: Download complete ranking data for external analysis or team sharing
All charts, metrics, and tables update automatically based on your selected time period.
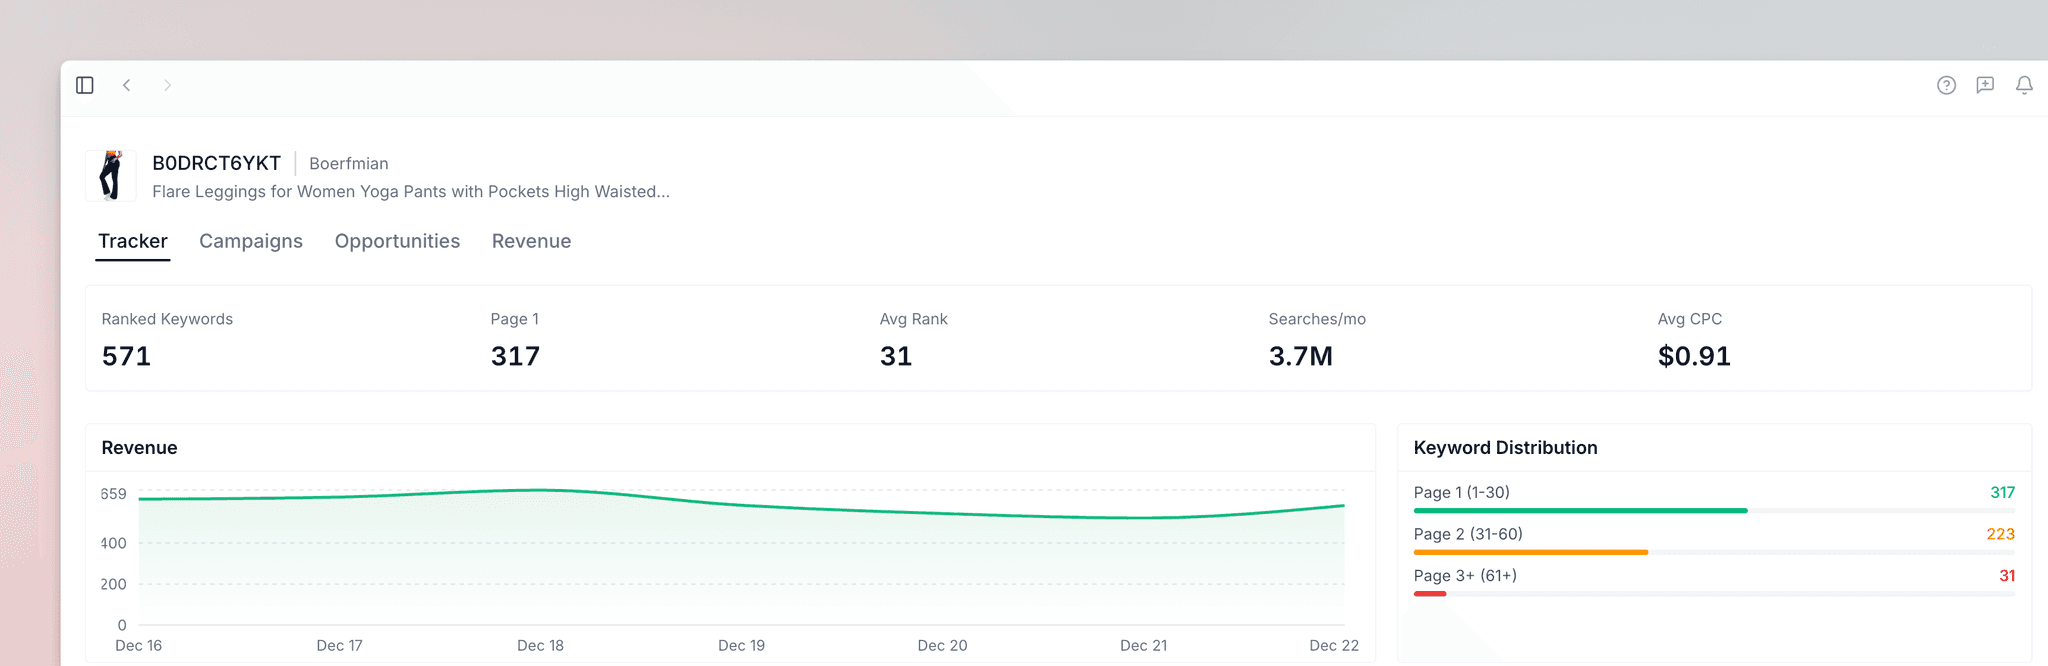
Overview Tab
Daily Sales Chart
Track revenue and unit sales for each day in your selected time period. This chart shows:
- Daily revenue — Total sales revenue for each day
- Average units sold — Mean daily unit sales across the period
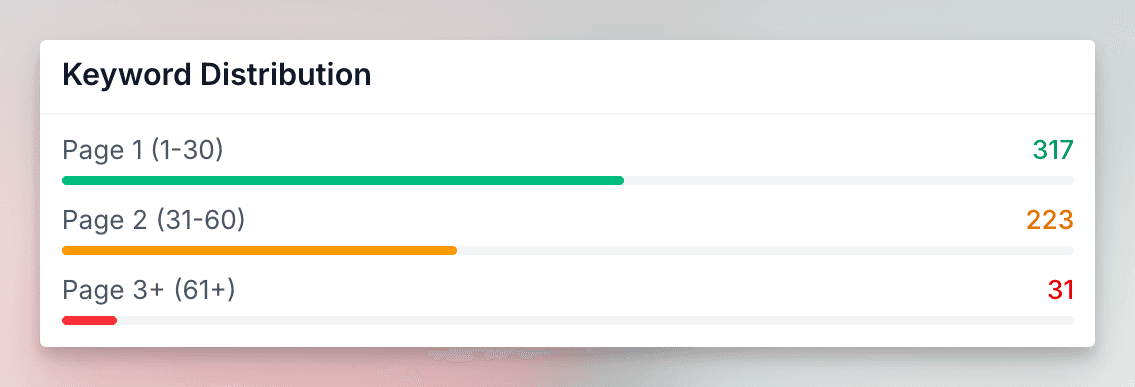
Keyword Distribution Chart
See how your keywords are distributed across Amazon search results pages:
- Page 1 rankings. Keywords ranking in positions 1–30
- Page 2 rankings. Keywords ranking in positions 31–60
- Page 3+ rankings. Keywords ranking in positions 61+
Click the bell icon to see recent ranking changes. Launch Fast highlights keywords that moved 5+ positions or entered page 1, helping you catch momentum early.
Key Metrics Summary
Five essential metrics provide a snapshot of your keyword performance:
- Total Ranked Keywords — How many keywords your product appears in search results for
- Keywords Ranking on Page 1 — Your high-visibility keywords
- Average Ranking Position — Mean ranking across all keywords
- Total Monthly Searches — Combined search volume across all your ranked keywords
- Average CPC — Mean cost for each click for advertising across your keyword set

Keyword Ranking Table
The Keywords Ranking table lists all keywords your product ranks as well as:
- Search Volume
- CPC
- Daily Rank
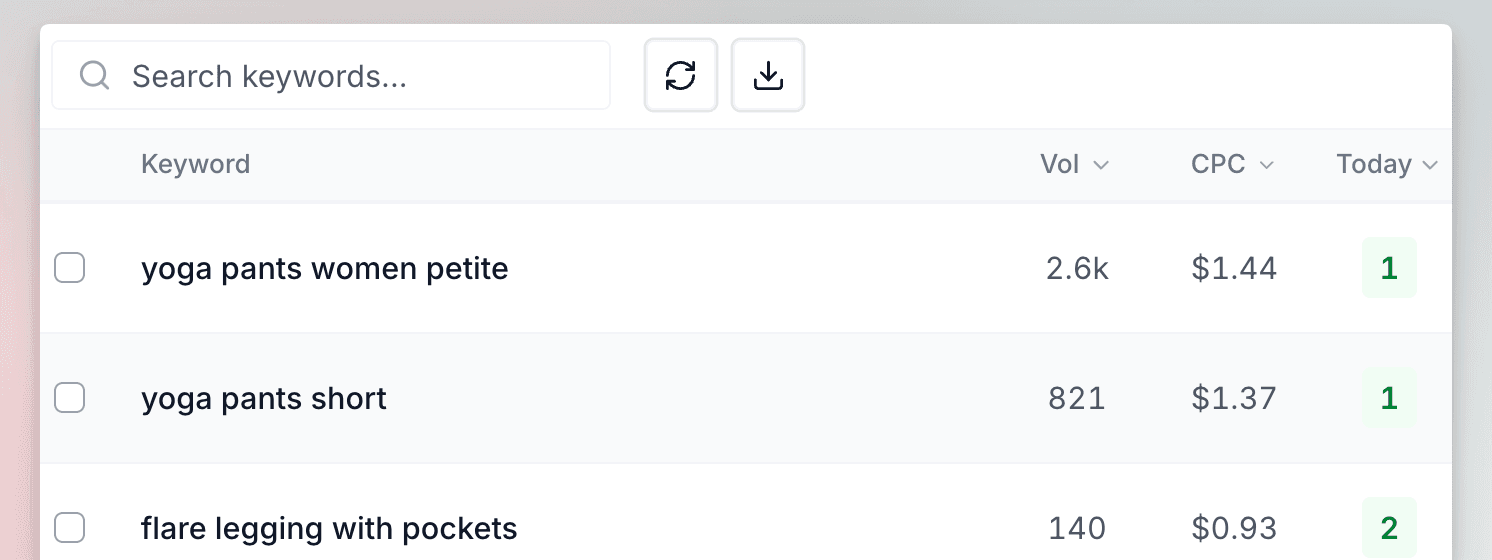
Rank tracking starts when you add a product. For example, if you add it on November 1, the first data is from November 1. Launch Fast automatically adds a new column each day.
Campaigns Tab
What are Campaigns?
A campaign groups keywords based on your business goals or optimization strategies. Common campaign types include:
- Competitor Targeting. Keywords your top competitors rank for
- Brand Defense — Branded terms to protect your market positioning
- Launch Keywords — Priority keywords for new product launches
- Seasonal Keywords — Terms related to specific times of year
- Market Segments. Keywords targeting specific customer demographics or use cases
Create and Manage Keyword Campaigns
On the Campaigns tab, click the "Manage Keywords" button. You will be able to:
- Add keywords to existing campaigns
- Create new campaigns and add keywords
- Edit campaign names to reflect evolving strategies
- Remove keywords from campaigns that no longer fit
Keep 5–15 keywords in each campaign. Review campaign performance each week. Adjust PPC spend and listing priorities for the keyword groups that produce the best results.

Viewing Campaigns
The Campaigns tab displays all your saved campaigns with summary metrics:
- Campaign name and keyword count
- Average ranking across all keywords in the campaign
- Total search volume across campaign keywords
Opportunities Tab
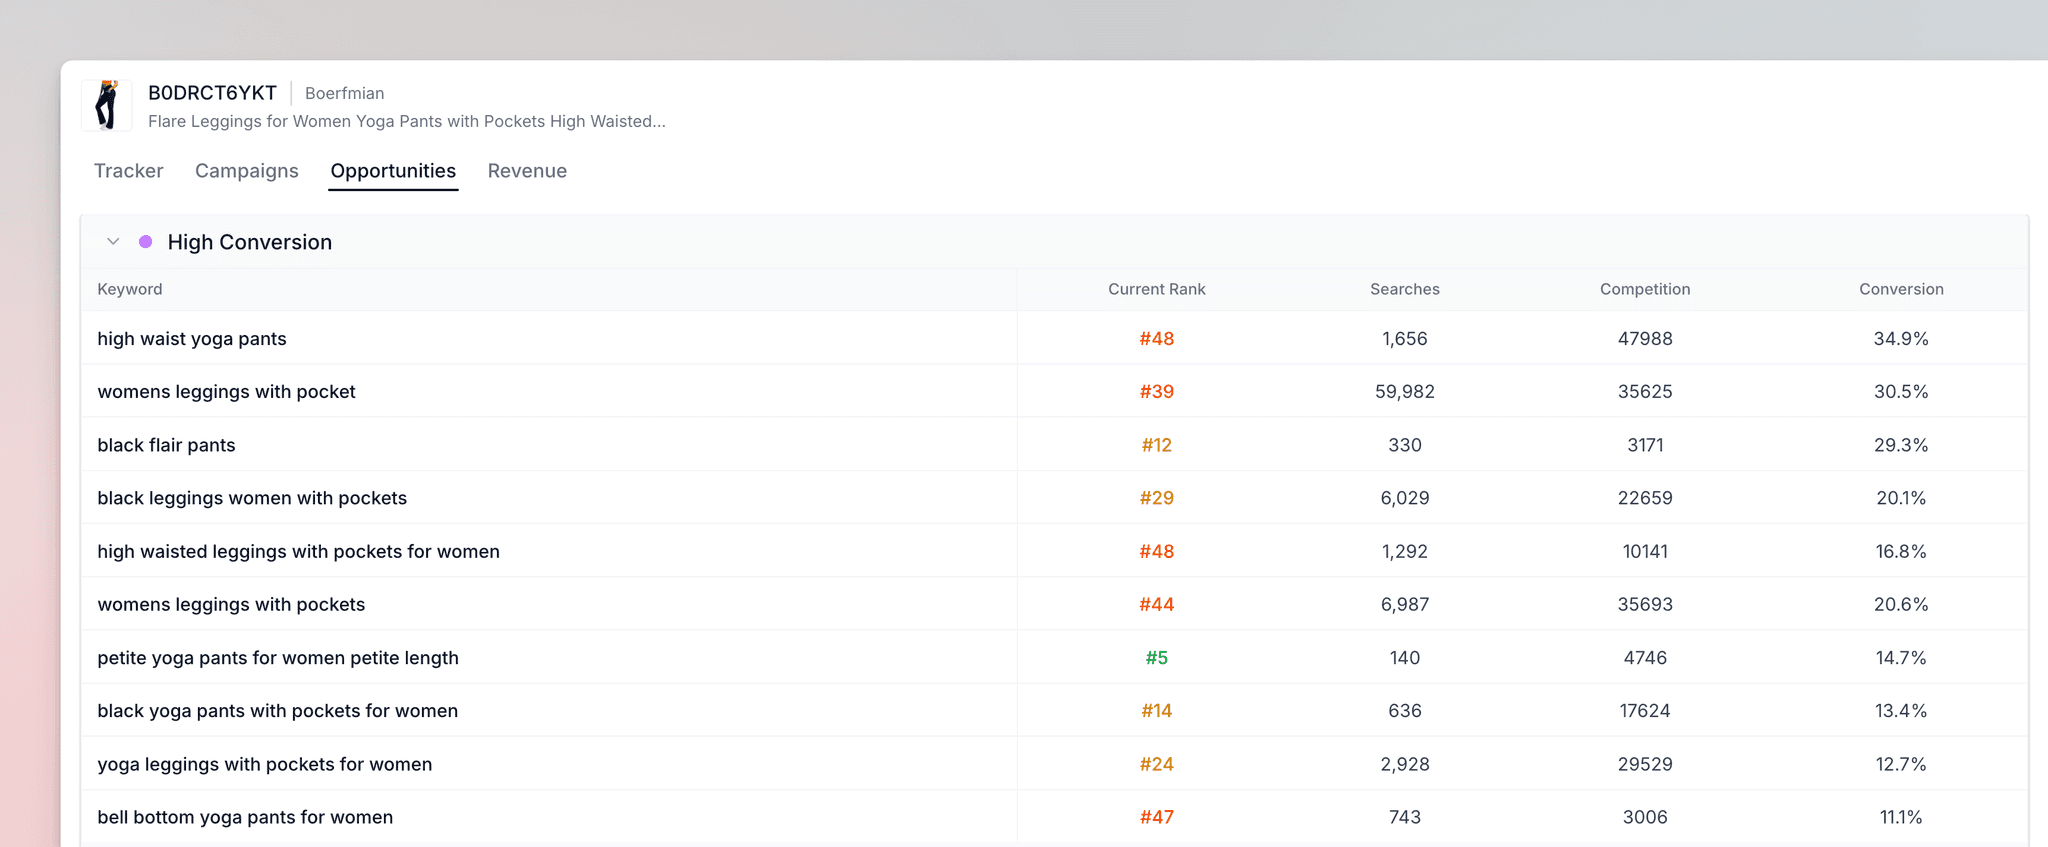
The 4 Opportunity Categories
Keywords with the best balance of search volume and conversion rate relative to competition
These represent your highest ROI opportunities. Target these keywords for:
- Listing optimization to improve organic rankings
- Premium PPC budget allocation
- Long-term positioning and market share growth
High search volume keywords with fewer competitors
These keywords are easier to rank for organically with optimized listings. Focus on:
- Title, bullet points, and description optimization
- Backend search term updates
- A+ Content and enhanced brand content
Keywords with proven sales but minimal competition
The fastest path to revenue growth with focused effort. Prioritize these for:
- Immediate PPC campaigns to capture traffic quickly
- Listing tweaks to improve click-through rates
- Short-term sales boosts during launches or promotions
Keywords with excellent conversion rates and low advertising costs
Maximize profit for each click by prioritizing these in your PPC campaigns:
- Allocate higher bids for these keywords in Sponsored Products
- Use exact match targeting to capture high-intent buyers
- Monitor closely to maintain low ACoS
Opportunity Table Metrics
Each opportunity category displays keywords in a table with these performance indicators:
| Metric | What It Tells You |
|---|---|
| Current Rank | Your product's current position in Amazon search results for this keyword |
| Searches | Monthly search volume on Amazon (indicates demand) |
| Competition | Average number of competing products actively ranking for this keyword |
| Conversion % | Estimated percentage of searches that result in a purchase (modeled estimate) |
| Target Rank | Recommended ranking position to achieve meaningful traffic and sales |
Revenue Tab
Market Purchase Opportunity Map
An interactive heatmap showing total market purchases for each keyword, helping you spot high-demand opportunities at a glance.
Key metrics displayed:
- Total Market Demand — Total number of purchases in this market across all competing products
- Your Page 1 Coverage % — Percentage of your keywords ranking on page 1
- Average Conversion % — Mean conversion rate across all your ranked keywords
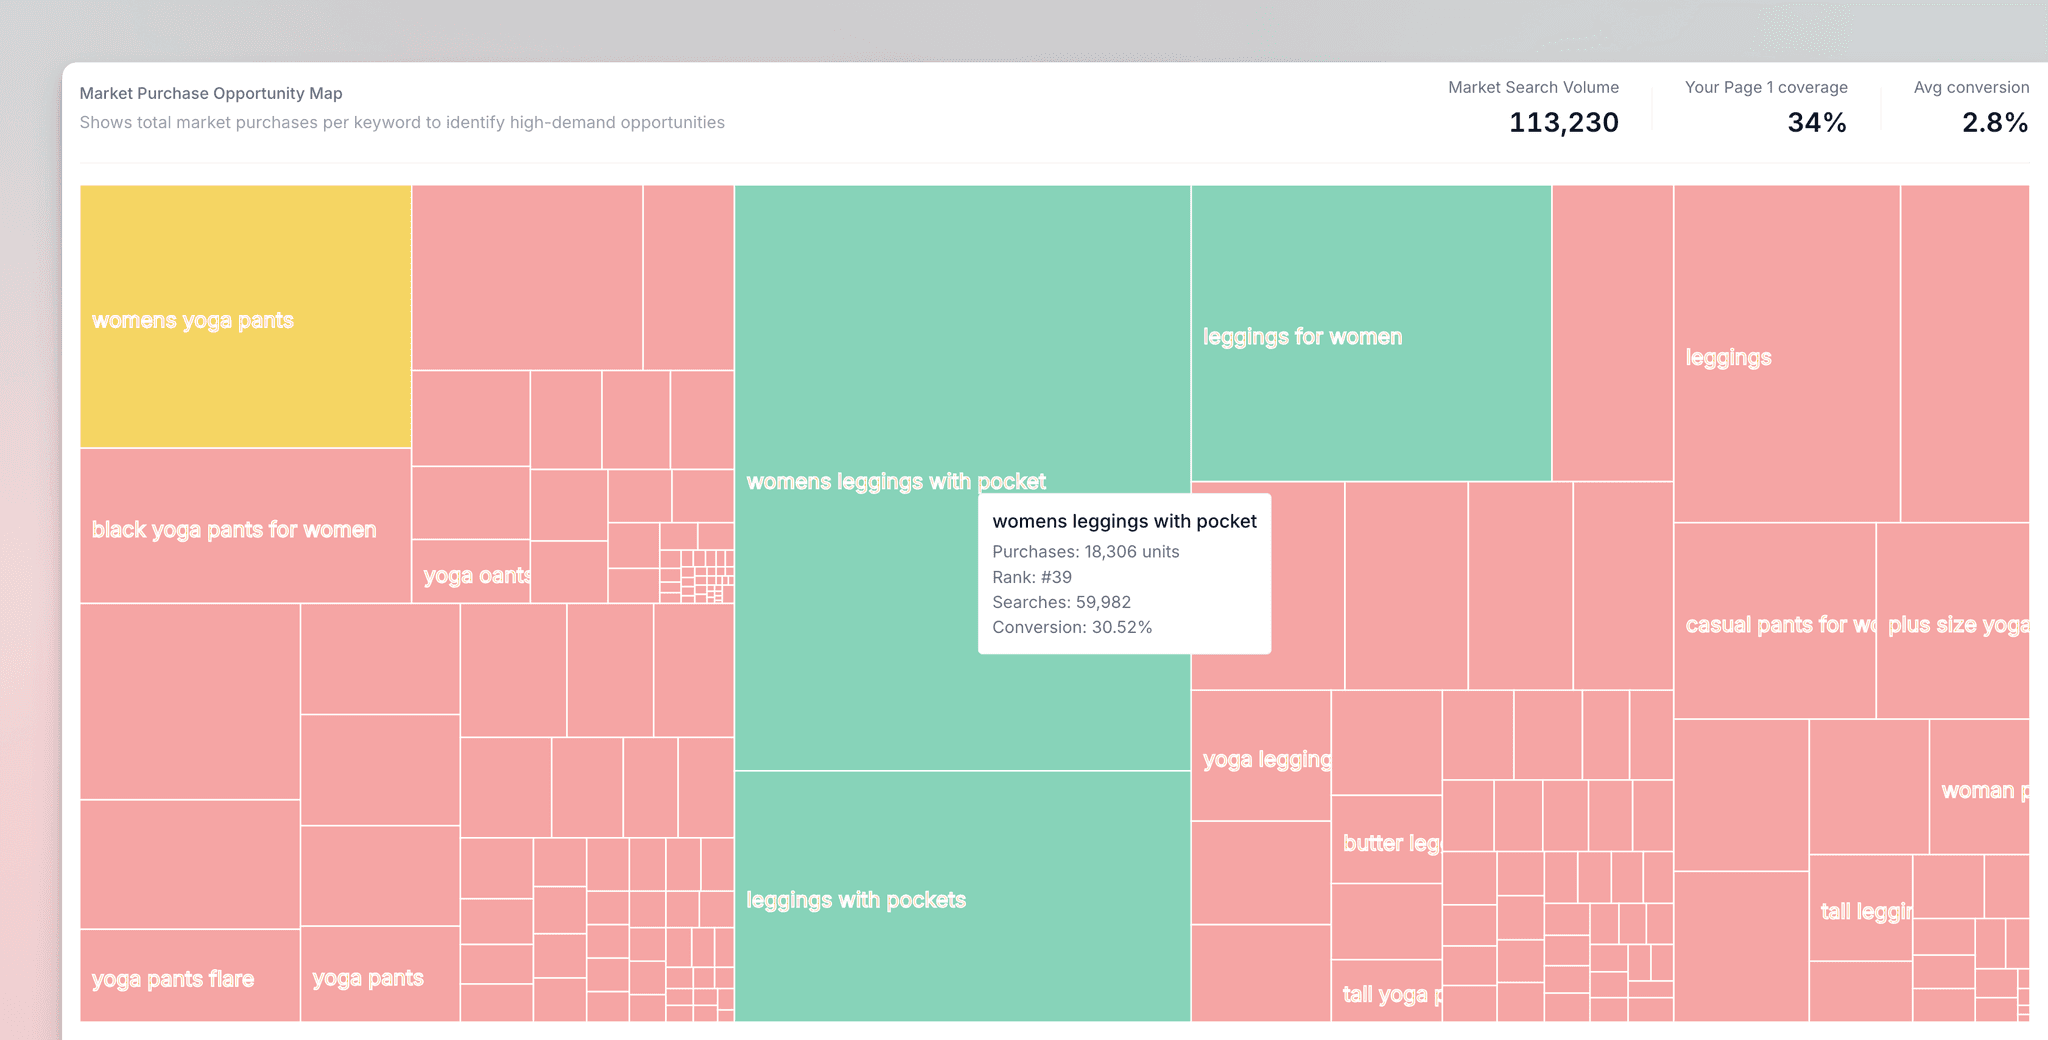
Using the heatmap:
Hover over a keyword spot to reveal:
- Purchases — Total market purchases for this keyword
- Rank — Your current ranking position
- Searches — Monthly search volume
- Conversions — Estimated conversion percentage
Darker or larger spots indicate keywords with higher purchase volumes. Use this visualization to quickly identify high-demand keywords where you are under-positioned.
Keyword Market Demand Analysis Table
This table helps you compare your current ranking against total market purchases, revealing untapped revenue opportunities.
| Column | What It Means |
|---|---|
| Keyword | The search term customers use |
| Current Rank | Your product's position in search results |
| Searches | Monthly search volume |
| Total Purchases | Market-wide purchases driven by this keyword (all competing products) |
| Conversion % | Estimated search-to-purchase rate |
| Opportunity Size | Total purchases for this keyword (represents revenue potential if you improve ranking) |
How to interpret:
- Large opportunity size + low current rank = high-potential optimization target
- Keywords with high purchases where you rank on page 2 or 3 represent revenue you leave on the table
- Focus optimization efforts on keywords with proven purchase volume where you are not yet capturing share
Best Practices
Track your top revenue-generating products first, then add competitor ASINs to identify gaps in your keyword strategy.
Organize 5–15 keywords for each campaign for clarity. Review performance weekly to adjust PPC spending and optimization priorities.
Start with "Quick Win" and "Low Competition" keywords for fastest results. Allocate PPC budget to "High Conversion" keywords to maximize profit margins.
Check daily during launches or promotions for significant ranking changes. Review Opportunities weekly and Revenue tab monthly for long-term trends.