
Product Explorer
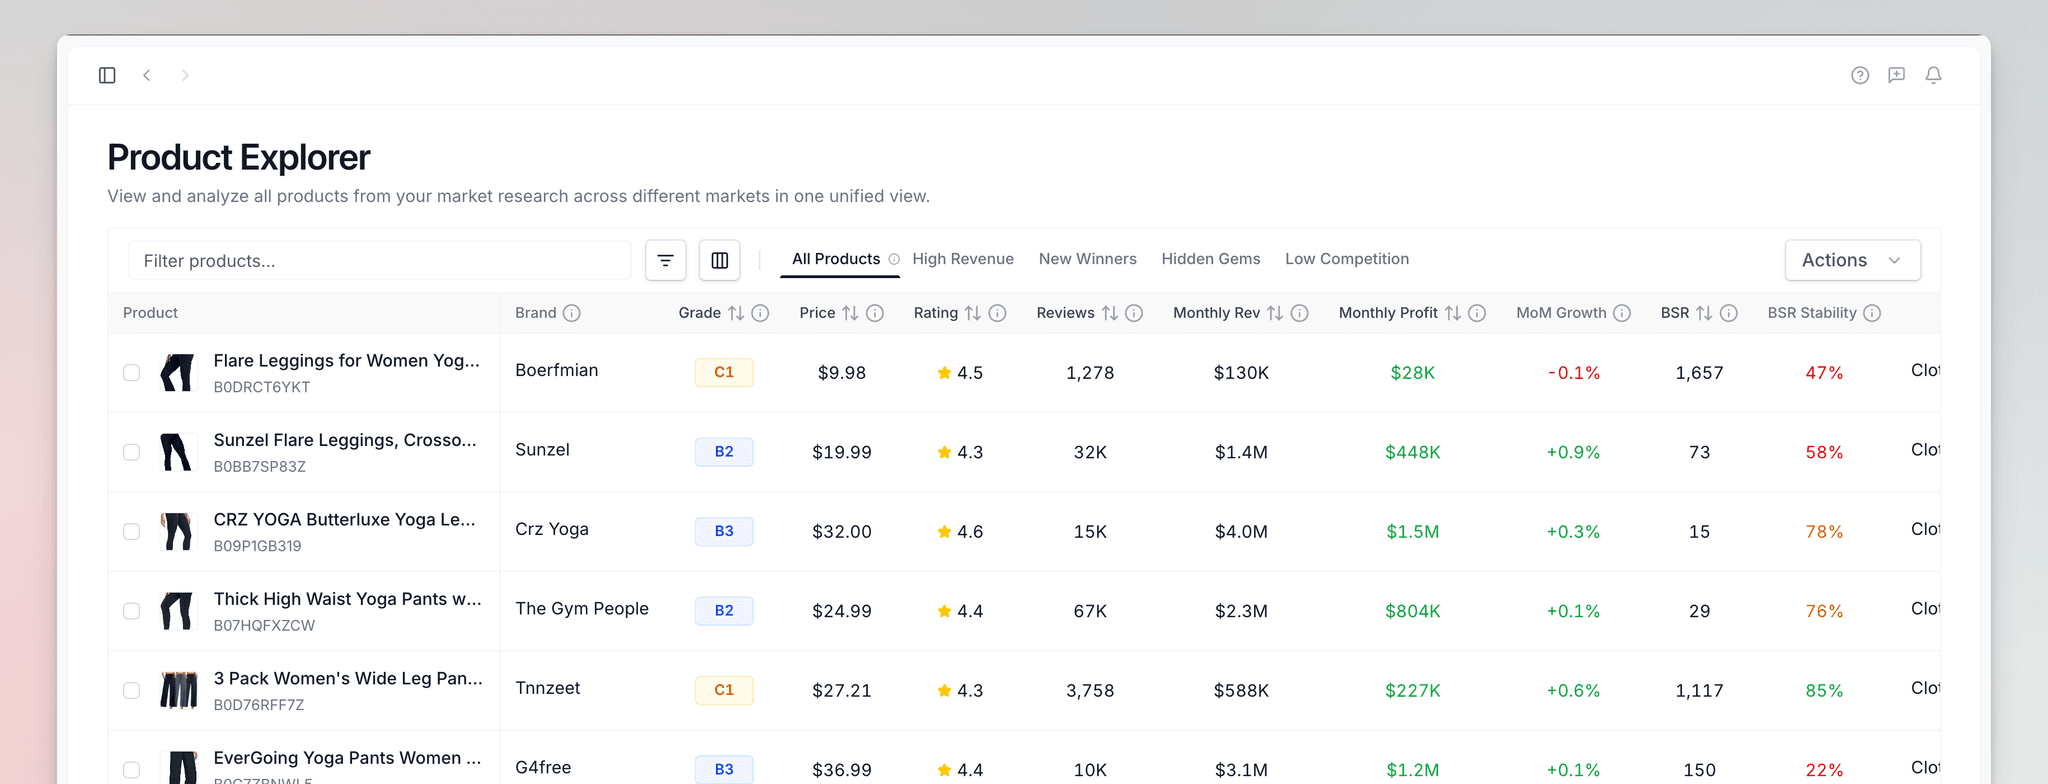
Your centralized product database where each Amazon product you saved during market research comes together in one powerful view. Browse, filter, compare, and export your discoveries.
Overview
Use Product Explorer to:
- Browse all saved products in a unified view
- Filter using quick presets or custom ranges
- Compare products side-by-side
- Export product data as CSV
- Manage your saved products database
How to Use Product Explorer
Access Product Explorer
Click "Product Explorer" in the left sidebar to open your saved products table.
Use Quick Filters
Click a of the preset filter tabs at the top to instantly view products matching proven success patterns:
- High Revenue. Products earning $10K+ for each month
- New Winners — Recently launched products (≤9 months) earning $10K+ profit/month
- Hidden Gems. Products with good revenue ($5K+) but under 100 reviews
- Low Competition — Low BSR products with under 200 reviews
Apply Advanced Filters
Click the filter icon in the table header. Set custom ranges for revenue, profit, reviews, BSR, rating, category, and other metrics. Combine filters to find suitable products.

Find Product Inspiration
Spot trends, analyze successful products, and identify market gaps. Use the data to inspire your next product launch or validate existing ideas.
Understanding Product Metrics
| Column | What It Means |
|---|---|
| Brand Name | The company or brand that sells this product. Recognizable brands usually sell better but can have more competition. |
| Product Price | Current selling price on Amazon. Higher prices can mean better profit margins but can reduce the number of customers willing to buy. |
| Review Count | Total number of customer reviews. More than 1,000 reviews usually means tough competition, while fewer reviews might be easier to enter. |
| Monthly Revenue | Total sales revenue for each month, before cost deductions. Signals how much customers spend on this product each month. |
| Monthly Profit | Estimated profit each month after deducting all costs. Uses standard cost assumptions and can differ from actual profits. |
| Month-over-Month Growth | Compares sales performance across up to 3 months to show if this product grows or declining. Only available when we have enough historical data. |
| Best Seller Rank (BSR) | Amazon's ranking of how well this product sells in its category. Lower numbers are better—a BSR of 1,000 means top seller, while 100,000+ means slower sales. |
| BSR Stability | Shows how consistent the Best Seller Rank was over the past 90 days. Higher percentages mean steady sales, while lower numbers mean the rank bounces around. |
| Available Since | How long this product sold on Amazon. Newer products (under 6 months) have not proven themselves yet, while older products show staying power. |
Most metrics are explained in detail on the Market Research page.
Best Practices
Compare multiple products in the same price range to spot common features or positioning angles.
Look for products with strong profit margins in categories you understand.
Products with high revenue but low ratings can indicate underserved customer needs you can address.
Periodically review and delete outdated products. Export filtered lists as CSV to share with your team.