
Market Research
Analyze Markets turns product ideas into data for decisions. Search by keyword or ASIN. Select related listings. Generate a view of demand, competition, prices, reviews, and ad costs.
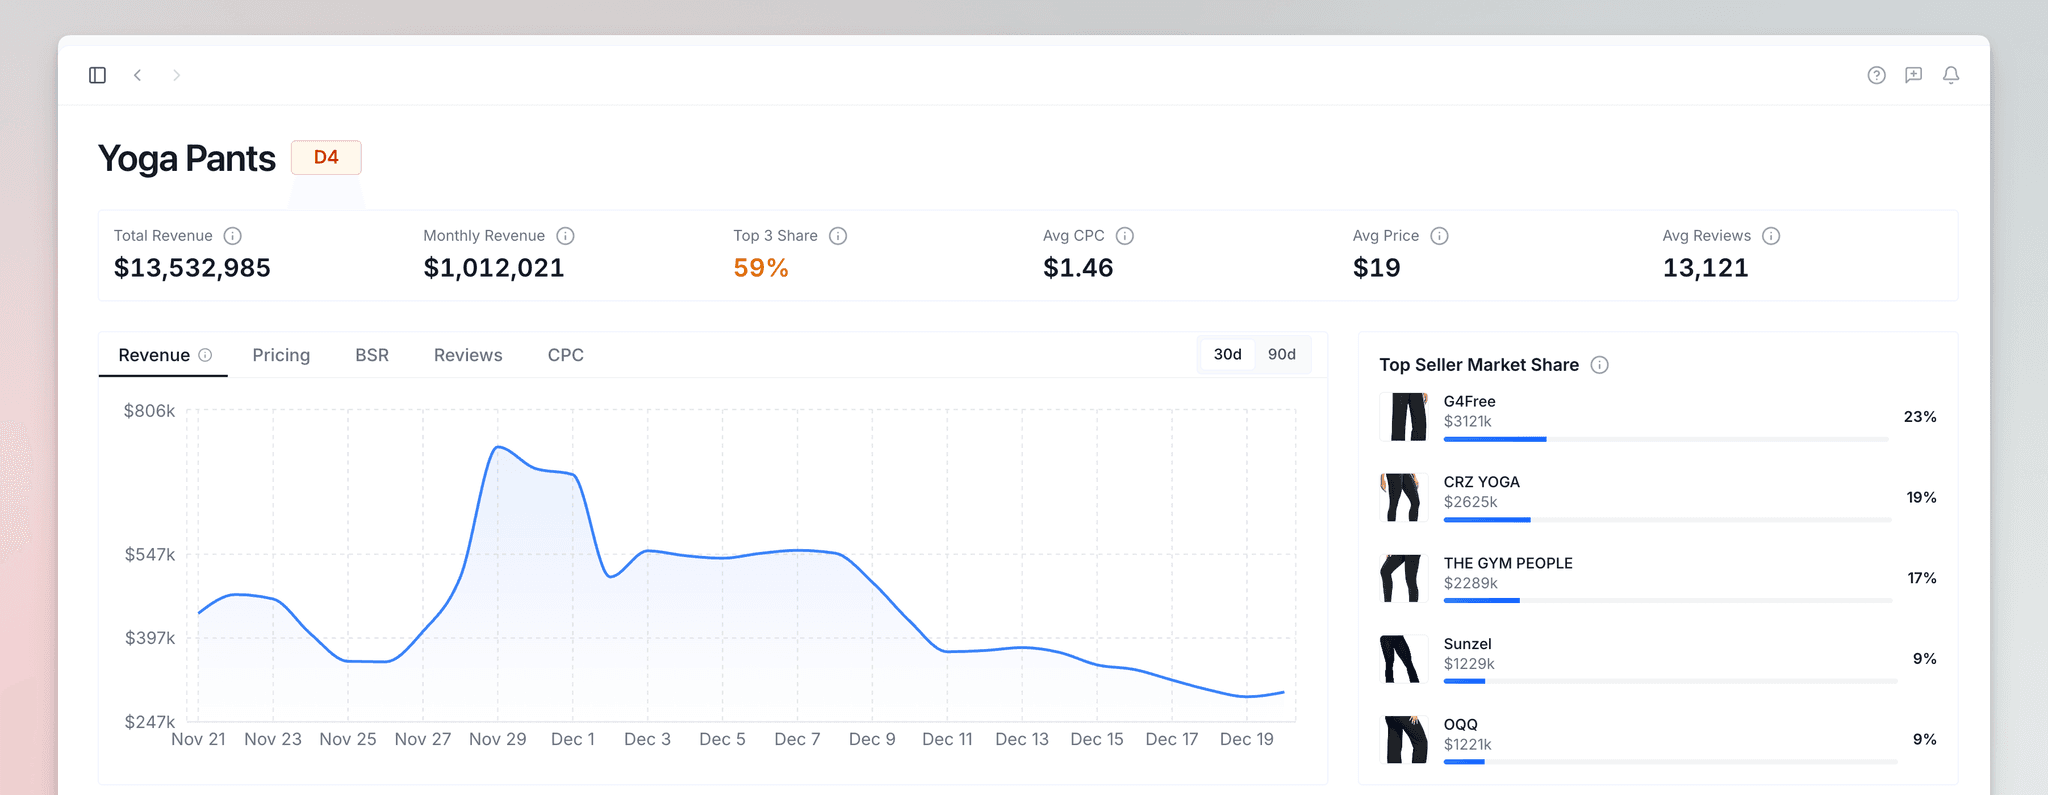
Overview
Analyze Markets moves you through the early research stages quickly and clearly:
- Analyze Markets — Enter a keyword or ASINs, and pick the listings that best represent the market.
- Deep Dive — Validate the market with interactive charts and 30/90-day trends.
- Market Research table — Save, filter, export, and manage all your markets.
The Launch Fast Grade
Launch Fast gives each market a proprietary grade from A10 to F1. The letter uses three ranges for each metric. The Launch Fast algorithm gives the number.
All four stats meet targets. A-grades must have each stat Ideal + 8 verified listings.
Healthy markets with stats to watch. A Good-range stat caps the market at B grade.
Stats outside our playbook. Each Bad stat drops grade one letter (1=C, 2=D, 3+=F).
What Stats We Look At
Launch Fast's grading algorithm considers 4 main stats for market research:
Price bands that leave room for profit.
% of sellers with under 500 reviews.
Enough demand without too much competition.
Affordable clicks keep launches profitable.
A strong grade identifies markets with demand, manageable competition, healthy price bands, and affordable ad costs. These conditions can support new listings.
How to Use Market Research
Follow this complete workflow to research markets and compare products:
Start a New Research
On the Launch Fast dashboard, click "New Research" in the left sidebar, or press ⌘K to open the research tool. Then enter your search:
- For keyword search: Enter a product keyword or niche like "yoga mat".
- For ASIN search: Paste 2–10 ASINs to analyze specific products directly. ASIN searches skip the selection step and jump straight to analysis.
Preview & Select Products
Launch Fast fetches the top 30 Amazon products for your keyword.
- Select exactly 15 high-relevance listings individually OR
- Click on Select First 15 to automatically select the first 15 products listed.
View Market Results
Click Analyze, this step can take a few minutes. When completed, Launch Fast compiles a unified market view with these key indicators:
- Market Grade (A10 – F1)
- Total Sales
- Average Price
- Search Volume
- CPC (Cost For each Click)
- Market Share
- New vs Established Listings
The Top Sellers dropdown lists the top 3 performing listings.
The New Sellers dropdown lists the newest listings.
Save Research
Click Save Research to add the market to your Market Research table. Launch Fast then opens Deep Dive for detailed validation.
Click on Start Over to discard the report and return to the beginning.
Market Deep Dive
The Market Deep Dive helps you validate if a market is truly worth entering using interactive, time-based analysis. To access a Market Deep Dive:
- Automatically open after clicking "Save Research" on an analysis
- Select a saved market in your Market Research table and click on "Deep Dive"
Market Metrics at a Glance
When viewing Deep Dive, these three summary metrics provide a quick market health check:
- Market Revenue — Total sales revenue across all products for the selected period.
- Average Price — Median price across products.
- Top 3 Market Share — Percentage of revenue controlled by the top three products.
The Four Key Checks
Is the market big enough?
Look for $50K+ for each month with steady or growing demand. Avoid declining or highly volatile markets unless planned for seasonality.
Will you make profit?
Identify where revenue concentrates. The $25–$150 band frequently balances margin and buyer intent.
Can you compete?
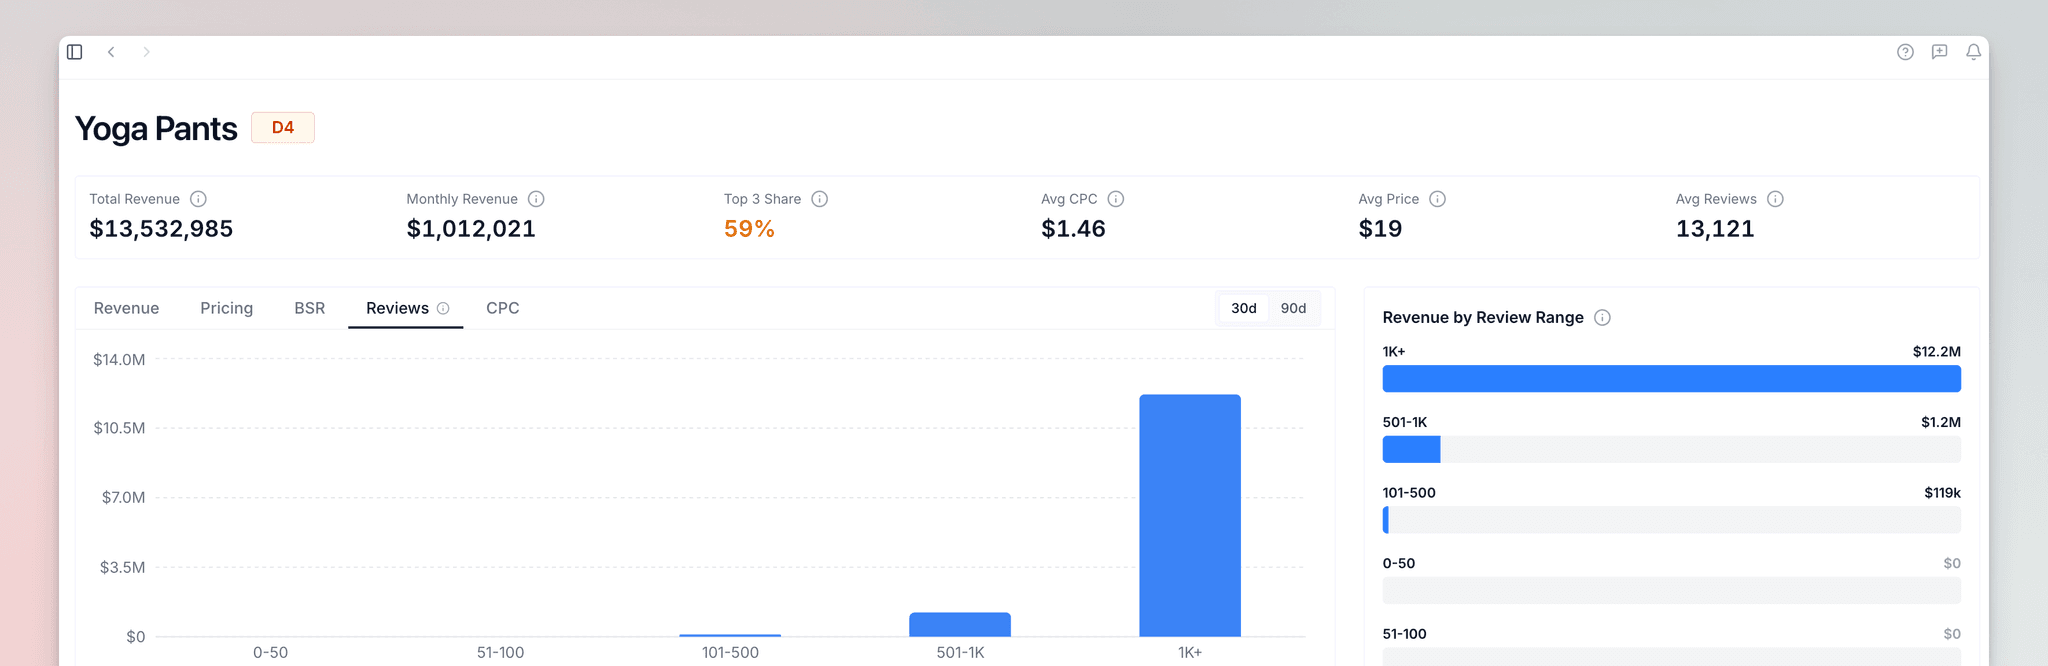
If only products with 5,000+ reviews sell, entry is harder. Look for markets where <500 reviews can perform.
Can you afford ads?
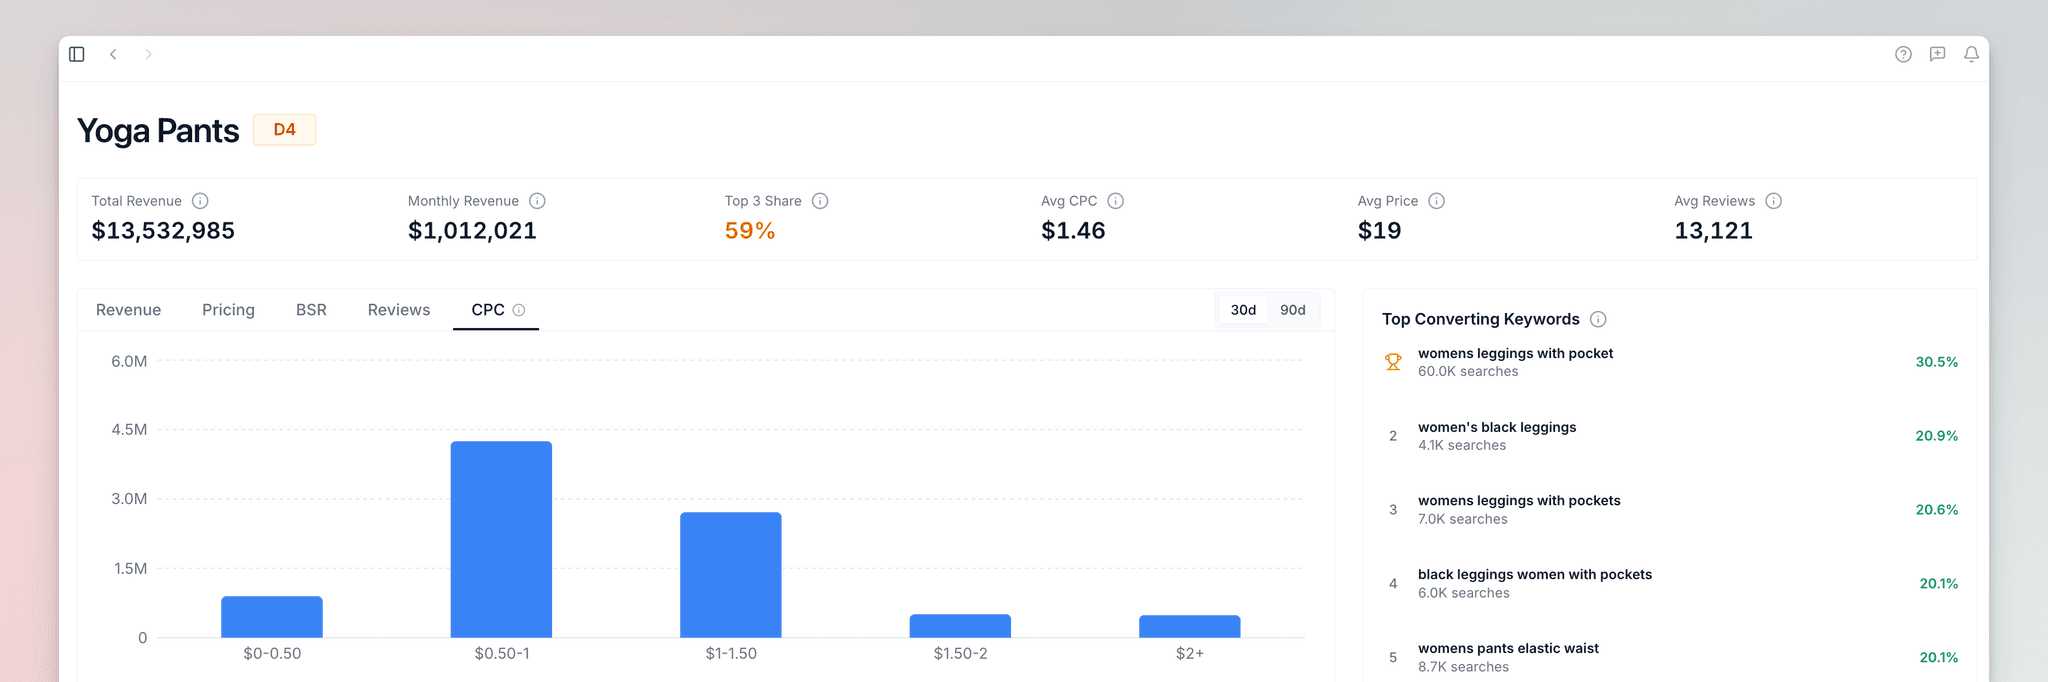
Favor high-volume keywords clustering in the $0.50–$1.50 CPC range for more efficient ad spend.
Key Metrics & Insights
All Deep Dive charts include hover tooltips and auto-updating visuals when you change selections.
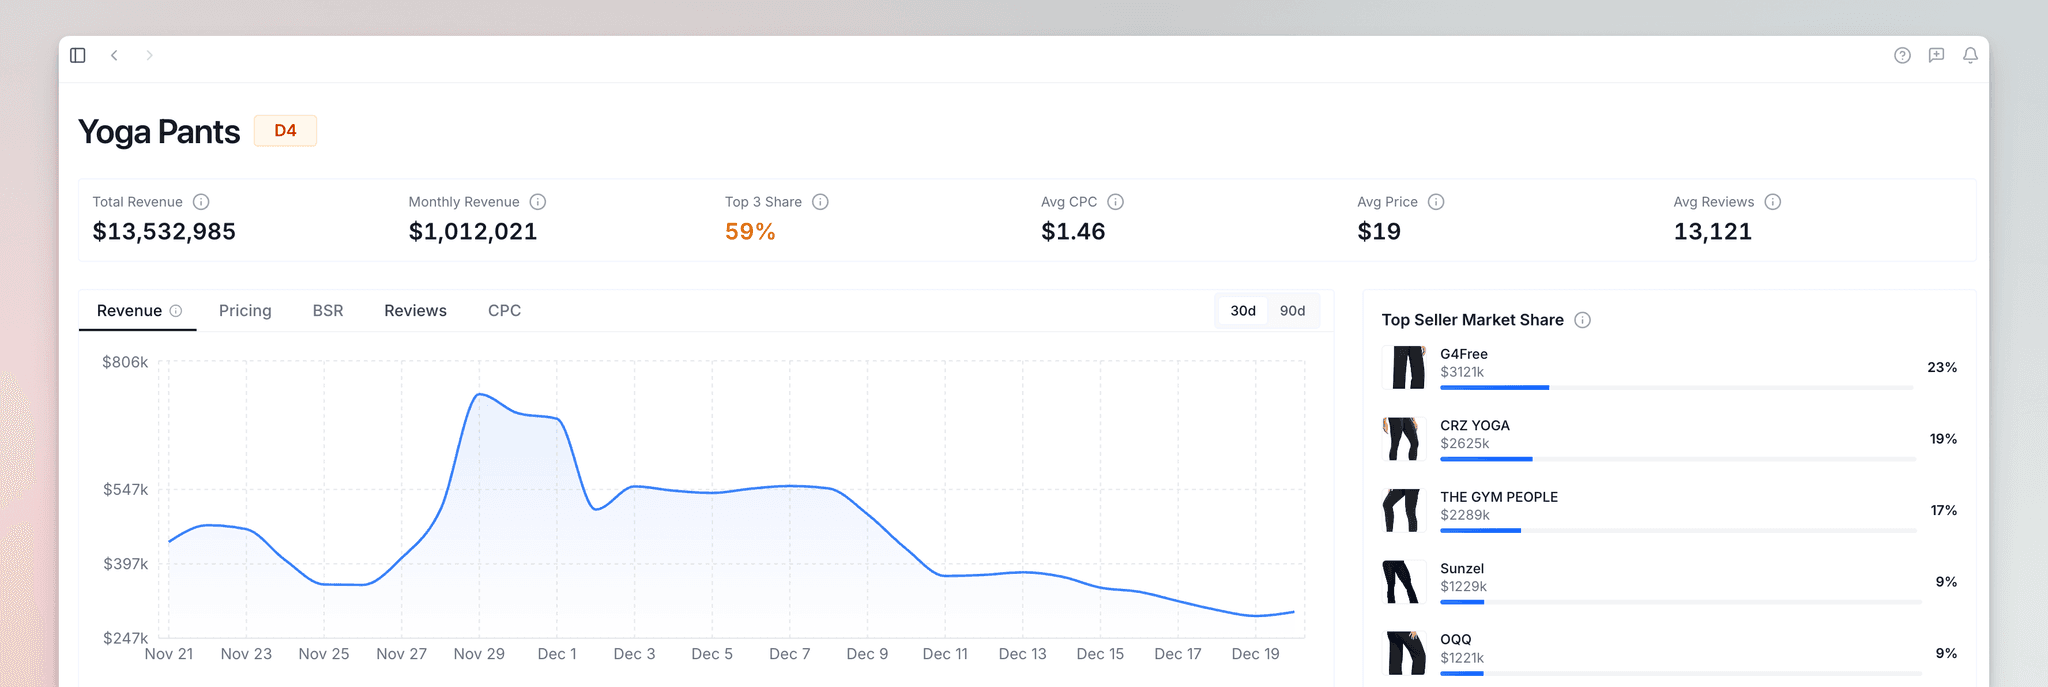
Historical Revenue
This chart tracks daily market sales. Use it to find steady growth, seasonal peaks, and suitable launch times. Top Seller Market Share shows which products get the most revenue. Market Share Distribution shows ranks 1–3, ranks 4–10, and the long tail.
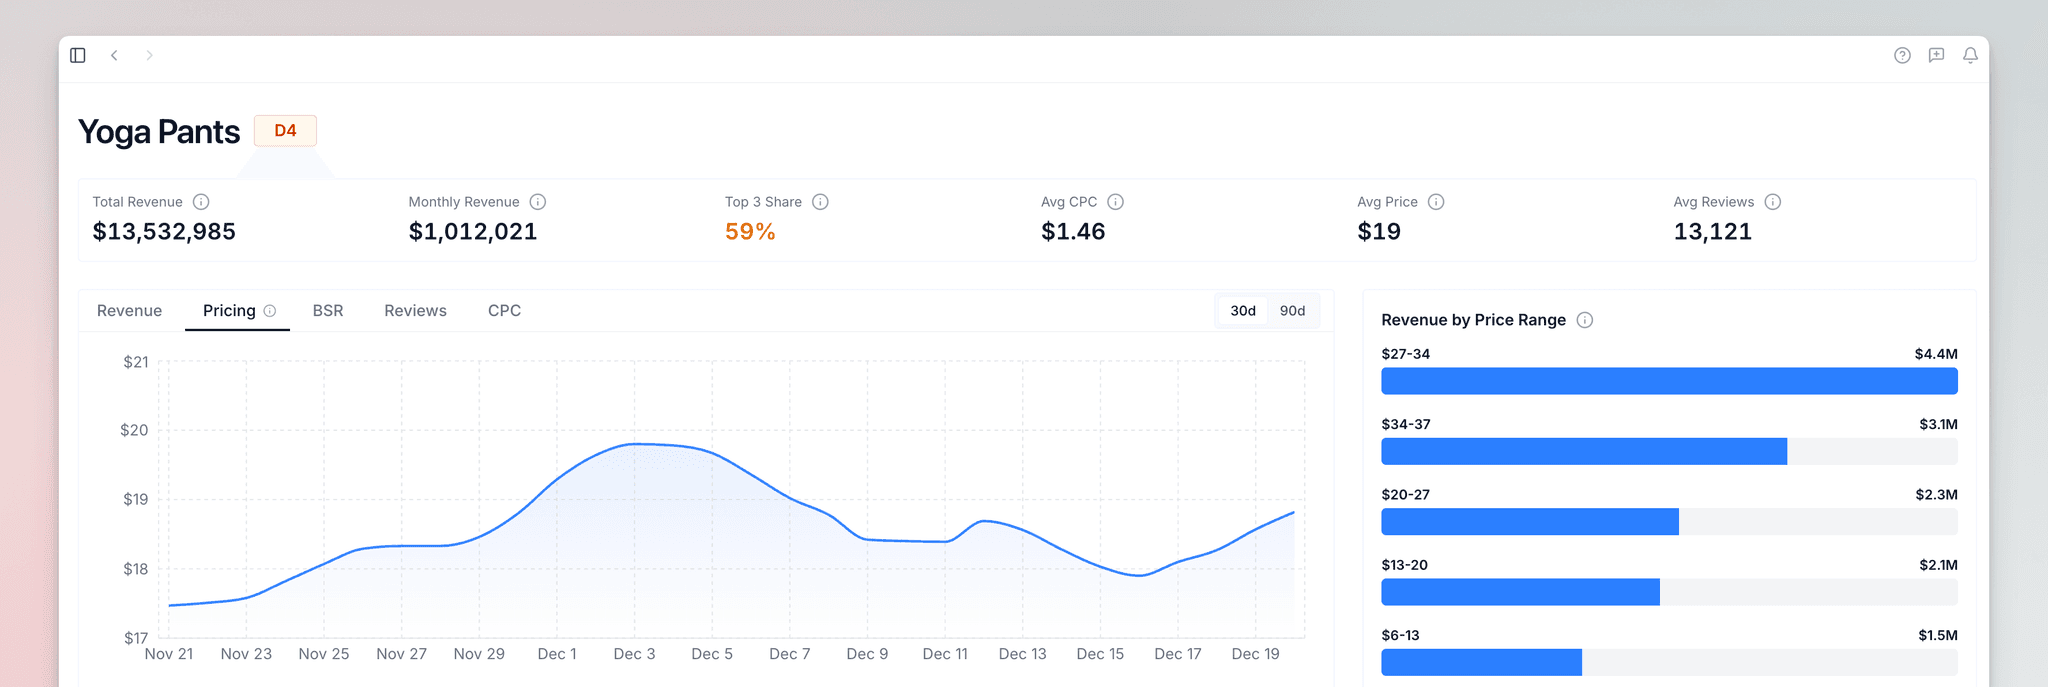
Historical Pricing
This chart helps you track competitor pricing over time to determine the best price point to enter the market. See how prices shifted, identify pricing trends, and find the sweet spot where you can compete profitably.
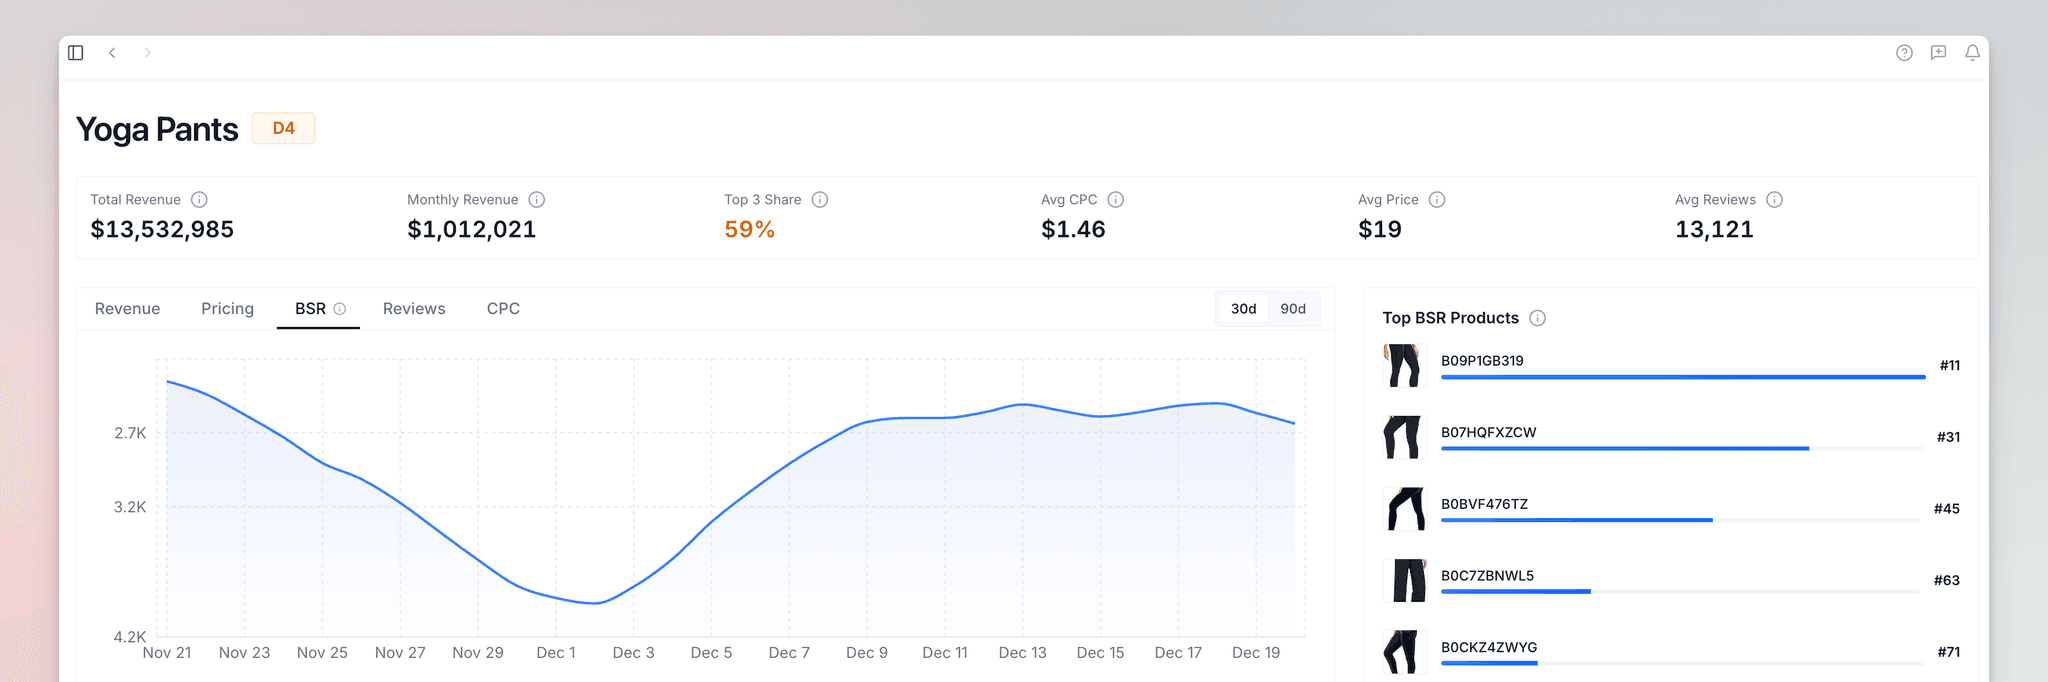
Historical BSR
This chart tracks competitors' historical Best Seller Rank over time, helping you understand how competitive the market really is. A stable BSR indicates consistent demand, while volatile rankings suggest opportunity for new entrants to break through.
Revenue by Review Count
This chart illustrates how review volume correlates with sales, helping you gauge the minimum review threshold needed to compete. It visualizes Review Segmentation across tiers so you can see where sales cluster and how steep the social-proof curve looks in your market.
PPC Research
This view shows the average cost for each click in the market. Use it to calculate if ads can be profitable. Top Converting Keywords gives initial launch targets. The keyword table gives related keywords, total search volume, and advertising costs.
Product-Level Comparisons
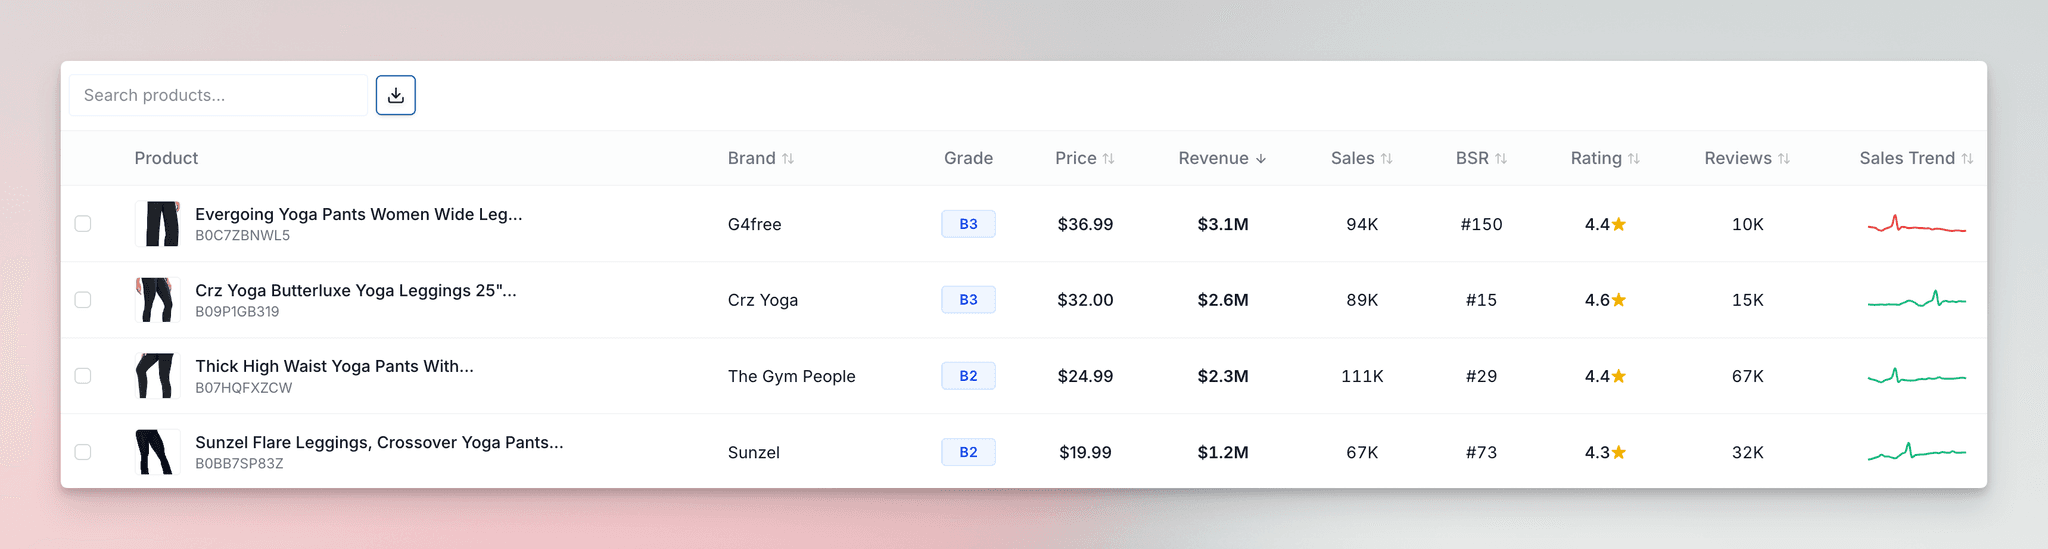
Product information includes Brand, Price, Monthly Revenue ($), Sales (Units), BSR (Best Seller Rank), and Reviews. A Sales Trend chart shows changes with time.
Use the checkboxes to select up to 3 products for comparison. Compare their historical revenue, price trends, and BSR performance. This information shows which competitors gain or lose ground.
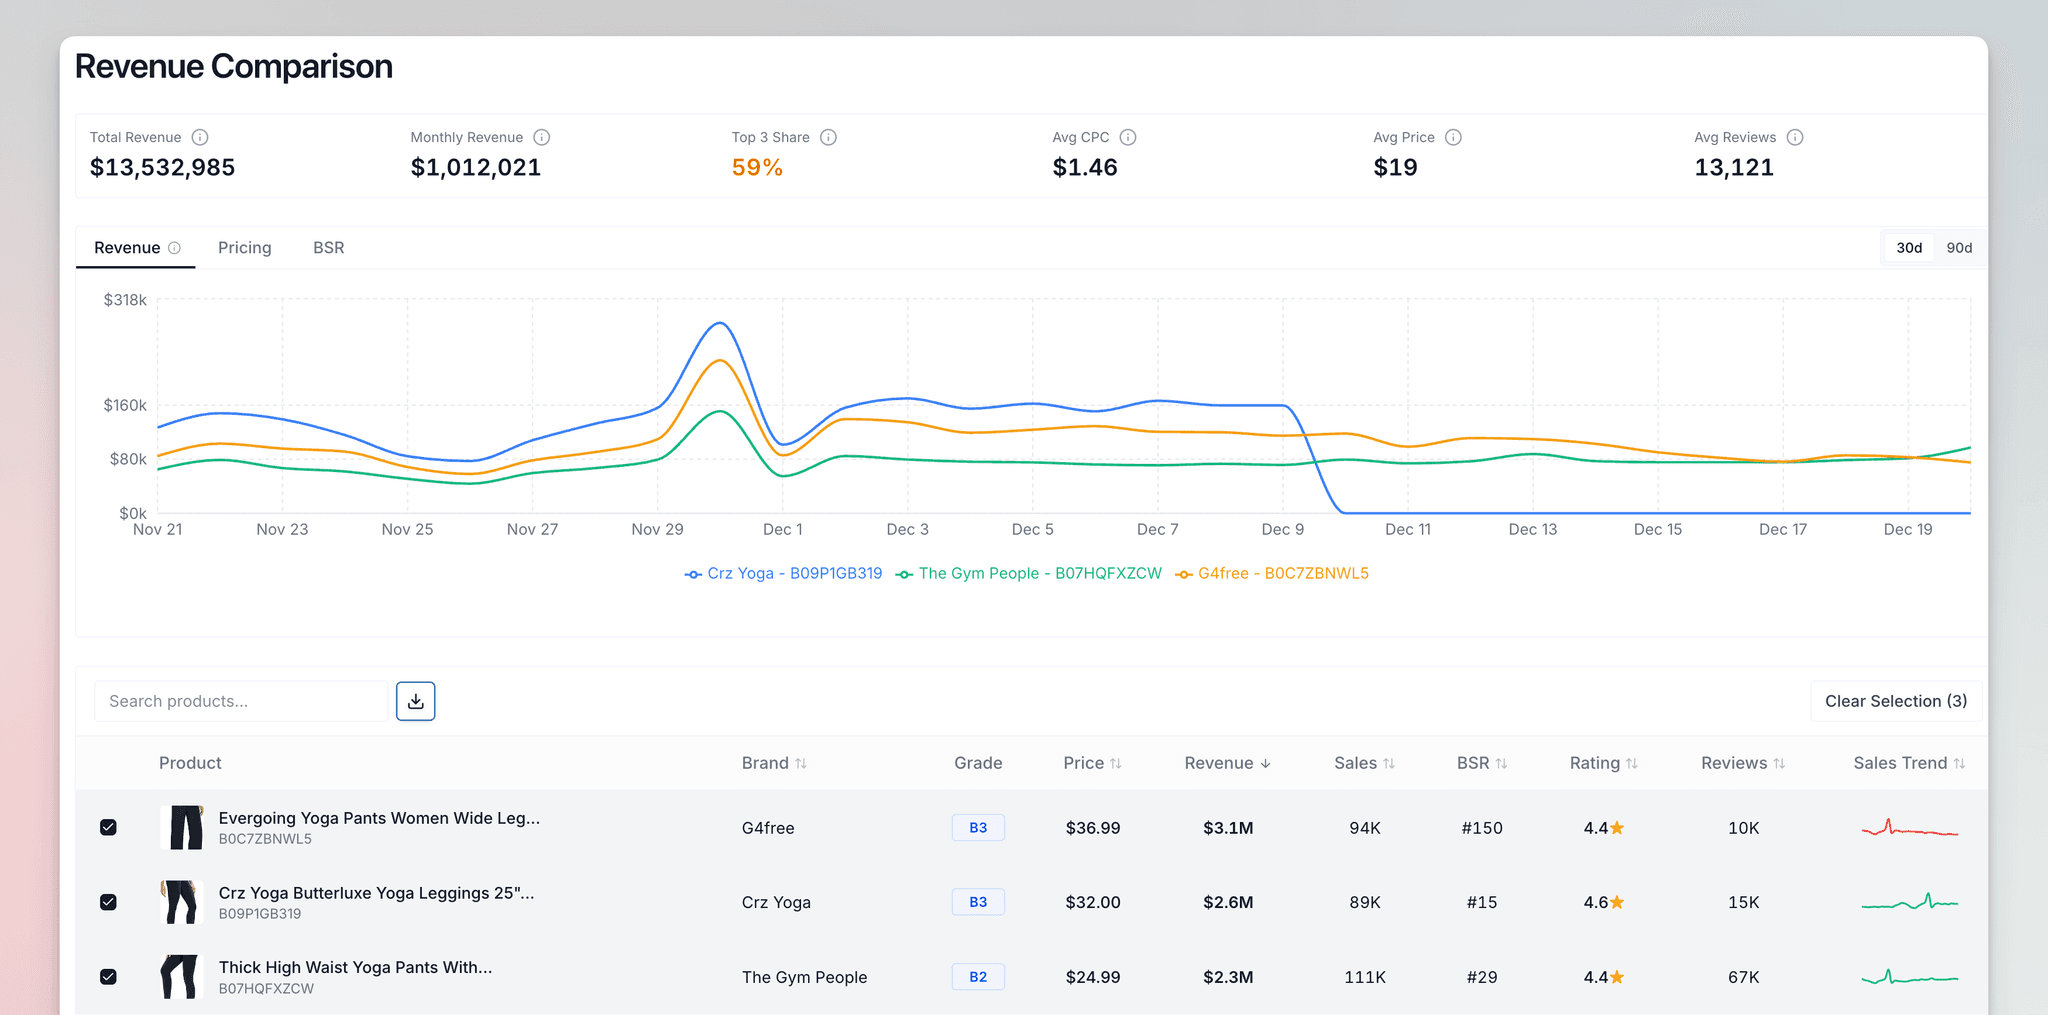
All charts update automatically based on your selections, giving you dynamic insights as you explore different product combinations.
Managing Saved Markets
After analyzing a market, product details and performance metrics will appear on the Market Research table. Click the arrow on a row to expand a market and see metrics for individual products.
Each market (and product when expanded) will have the following performance data available to view:
| Column | What It Means |
|---|---|
| Market Keyword | The main keyword used by customers (click the arrow to view all competing products) |
| Grade | Overall rating showing how good this market is for selling. A10 is the best (high demand, good margins, manageable competition) while F1 means it faces serious challenges. |
| Average Price | Median price across the market. Higher prices can mean better profit margins but can reduce the number of customers willing to buy. |
| Total Market Sales | Combined monthly sales from all products |
| Monthly Average Revenue | Total money products in this market bring in each month before costs are deducted. Shows how much customers spend. |
| Cost For each Click (CPC) | Average advertising cost for each click for this keyword. Higher costs indicate more competition in a market, while lower CPC signals cheaper potential traffic to your listing. |
| Monthly Search Volume | Total monthly searches for the keyword on Amazon (indicates customer demand) |
| Average Rating | Average star rating from customer reviews. Below 4.0 might indicate quality issues, while above 4.5 shows customers are very satisfied. |
| Product Category | The Amazon category where products are listed. Different categories have different fees and competition levels, which affects profitability. |
| Profit for Each Unit | Estimated net profit after all costs. This calculation uses standard cost assumptions and can differ from actual profit. |
| Cost of Goods (COGS) | Cost to purchase or produce a product. Estimated at ~30% of sale price (before receiving actual supplier quotes). |
| FBA Fulfillment Fees | What Amazon charges to store, pack, and ship each product for you. Typically ~15%, higher for bulky items. |
| Research Date | When this market analysis was last checked and updated. |
Additional Actions
Filtering options:
- Filter by individual columns — Show data based on your preferences
- Filter markets — Apply min & max filters on: Grade, Monthly Revenue, Profit for each Unit, Reviews, CPC, or Rating

Actions Menu:
- Deep Dive — Select a market and click Deep Dive in the top bar to view detailed analysis
- Add Products — Expand your saved market with related keywords or specific ASINs
- Find Suppliers — Open Supplier Research with market info pre-filled and auto-run
- Generate Report (PDF) — Launch the Market Report feature for this saved market
- Export CSV — Save the table data as a CSV (supports single or multi-select export)
- Delete — Remove a saved market that is no longer needed

Frequently Asked Questions
Start by analyzing 3-5 different markets in categories you are interested in. This helps you recognize patterns and builds confidence in identifying winning opportunities.