
Grading System
Launch Fast gives each market and product a grade such as B7 or A10. The letter shows the strength of the opportunity. The Launch Fast algorithm gives each number from 1 to 10. Use grades to scan markets and select the best markets for more research.
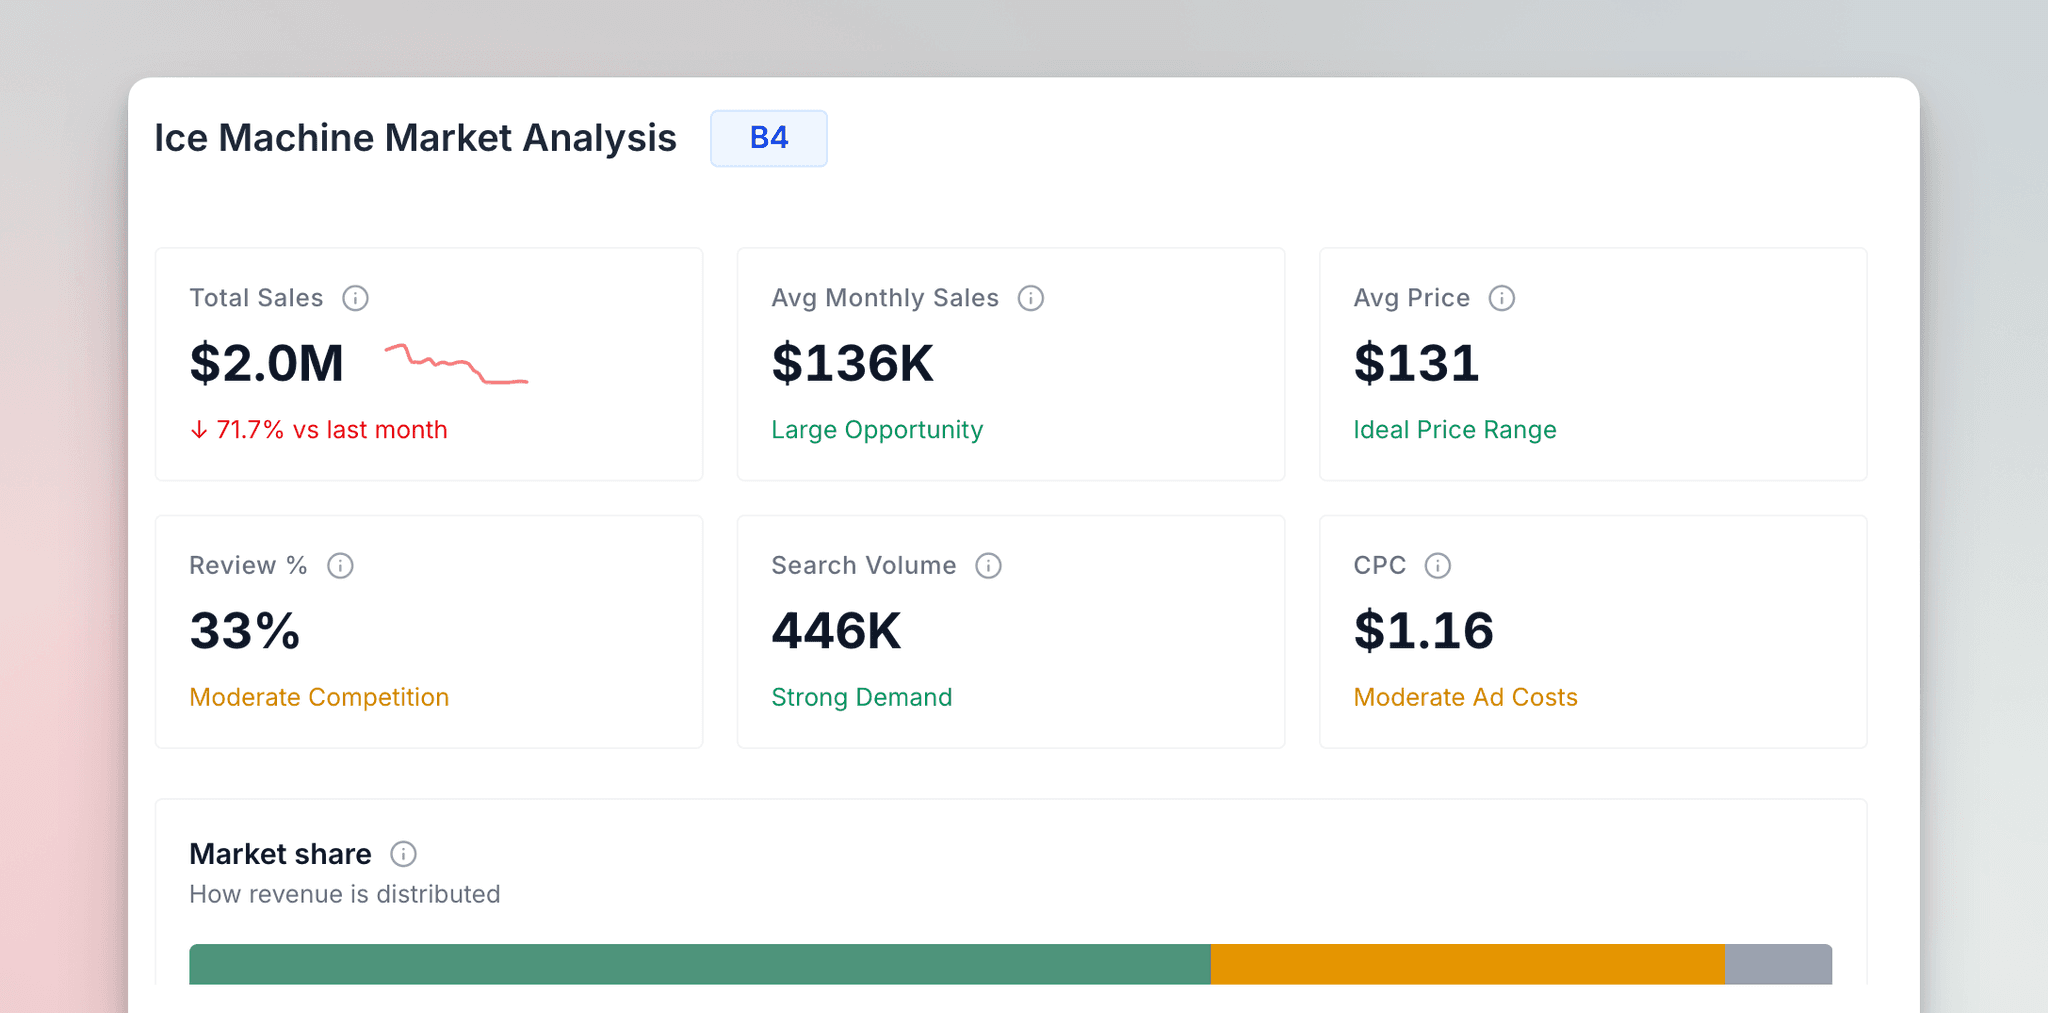
Overview
Grades give you a quick read on a market or product so you can decide what is worth a closer look.
Each grade has two parts:
- A letter (A through F) — how well the market or product scores across key factors. A is strong, F is usually not worth your time.
- A number (1 through 10). The Launch Fast algorithm gives this number.
When you see B7 on a market, the letter shows that the market is strong for most factors. Use the grade as a signal to do more research.
Grades help you scan and filter fast. They are not your final decision. Always check the actual data before you commit to a market.
Market Grades
The market grade evaluates the entire niche — not a single product. You will see it when you analyze a market in Market Research.
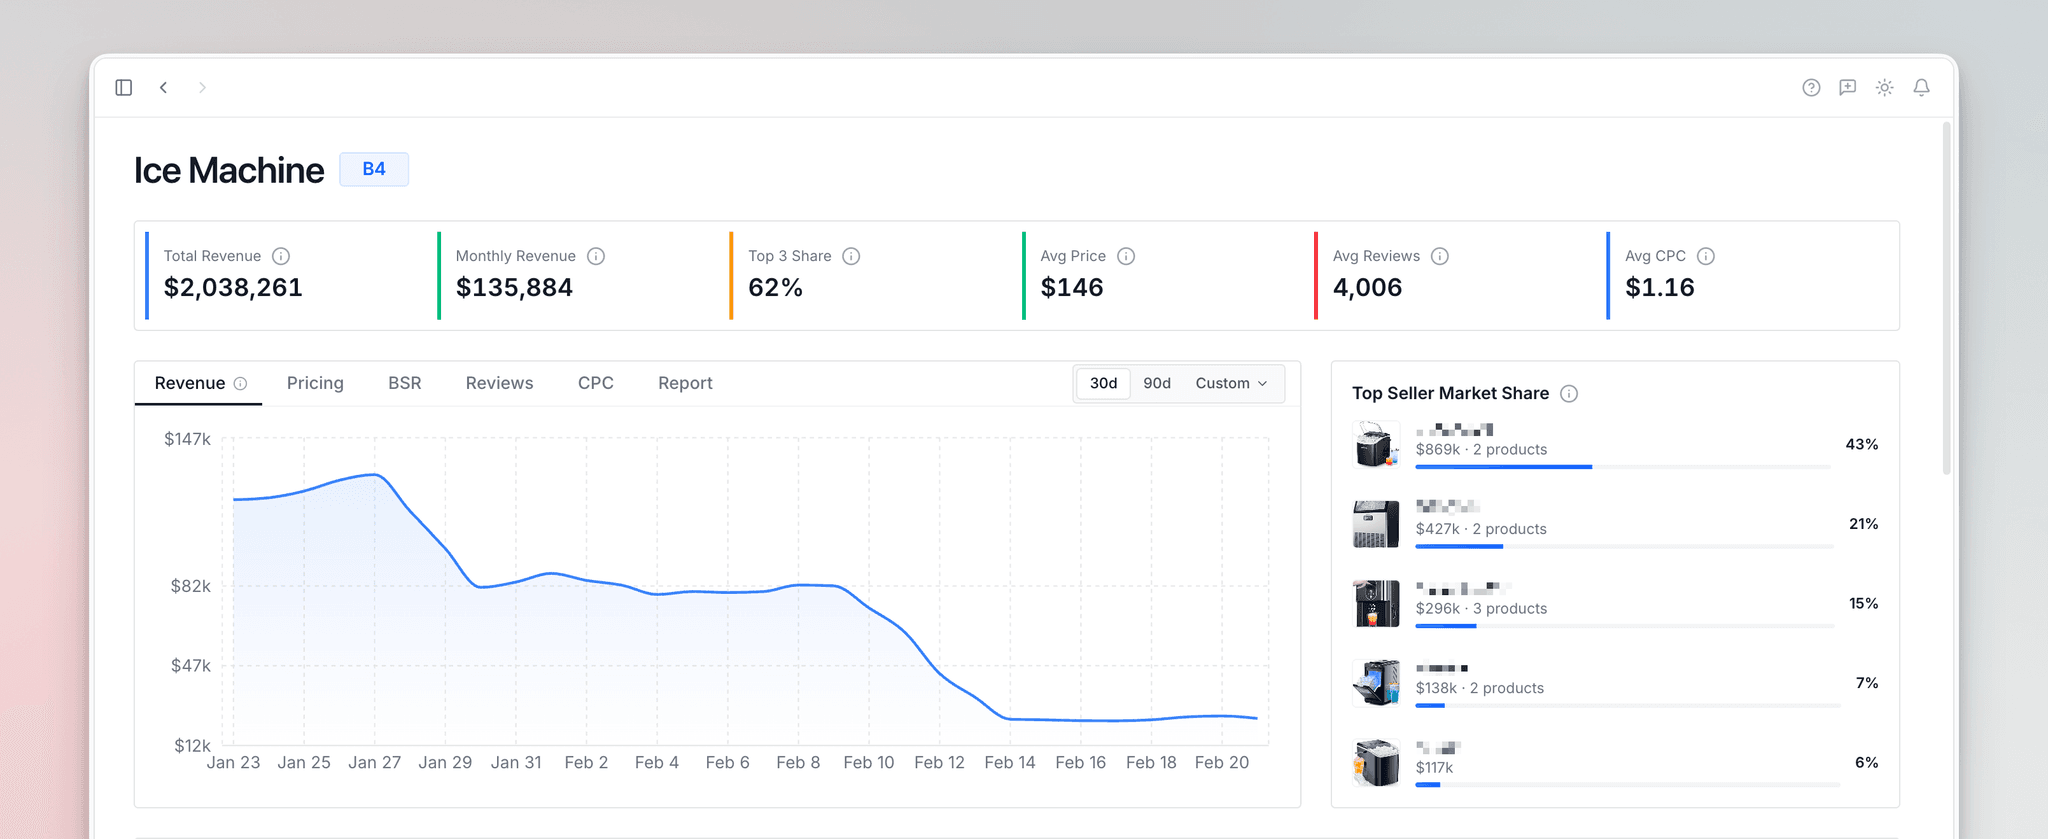
What Gets Evaluated
Launch Fast checks four metrics across all the products in a market. Each metric is scored as ideal, watch, or fail.
| Factor | What it measures | Ideal | Watch | Fail |
|---|---|---|---|---|
| Average Price | Typical selling price in the niche | $50 – $250 | $30 – $50 or $250 – $300 | Below $30 or above $300 |
| Average CPC | Cost for each click for advertising | Under $1.00 | $1.00 – $2.00 | Over $2.00 |
| Review Barrier | % of sellers with under 575 reviews | Over 50% under 575 | 30% – 50% under 575 | Under 30% |
| Average Revenue | Typical monthly revenue for each product | $25K – $1M | $5K – $25K or $1M – $1.5M | Below $5K or above $1.5M |
Launch Fast also measures market concentration. Review this metric separately from the grade.
How the Letter Works
The letter grade is based on how many factors fail.
| Grade | What it means | How to read it |
|---|---|---|
| A10 | All factors in the ideal range | Each metric looks good. Pricing, CPC, reviews, and revenue are all where you want them. |
| B10 | Nothing failing, but some factors are borderline | No hard blockers, but one or more metrics are close to the edge. Most good opportunities land here. |
| C10 | One factor fails | One important signal is off. Could work depending on which metric missed. |
| D10 | Two factors fail | Two metrics are weak. You must have a clear advantage to make this work. |
| F1 | Three or more factors fail | Multiple red flags. Usually skip unless you have a strong reason to test. |
How Launch Fast Gives the Number
The Launch Fast algorithm gives each number from 1 to 10.
Why These Thresholds
These ranges are set for private label sellers getting into Amazon. Here is the thinking behind each one.
-
Average Price: $50–$250 ideal
- Markets below $30 average frequently have tight margins after fees and ads.
- Above $300, unit volume usually drops and you want more capital upfront.
- The $50–$250 range usually gives enough margin to absorb fees and ads while moving units.
-
Average CPC: Under $1.00 ideal
- CPC is your cost to get seen.
- Under $1.00 usually supports a profitable launch.
- Over $2.00 can drain your margins unless your listings convert really well.
-
Review Barrier: Over 50% under 575 reviews ideal
- When most sellers have fewer than 575 reviews, new entrants have more room to compete on equal footing.
- If under 30% are below that threshold, established sellers tend to control trust and sales history.
-
Average Revenue: $25K–$1M ideal
- Below $5K average for each product is frequently too small to build a real business around.
- Above $1.5M usually means big players with big budgets.
Product Grades
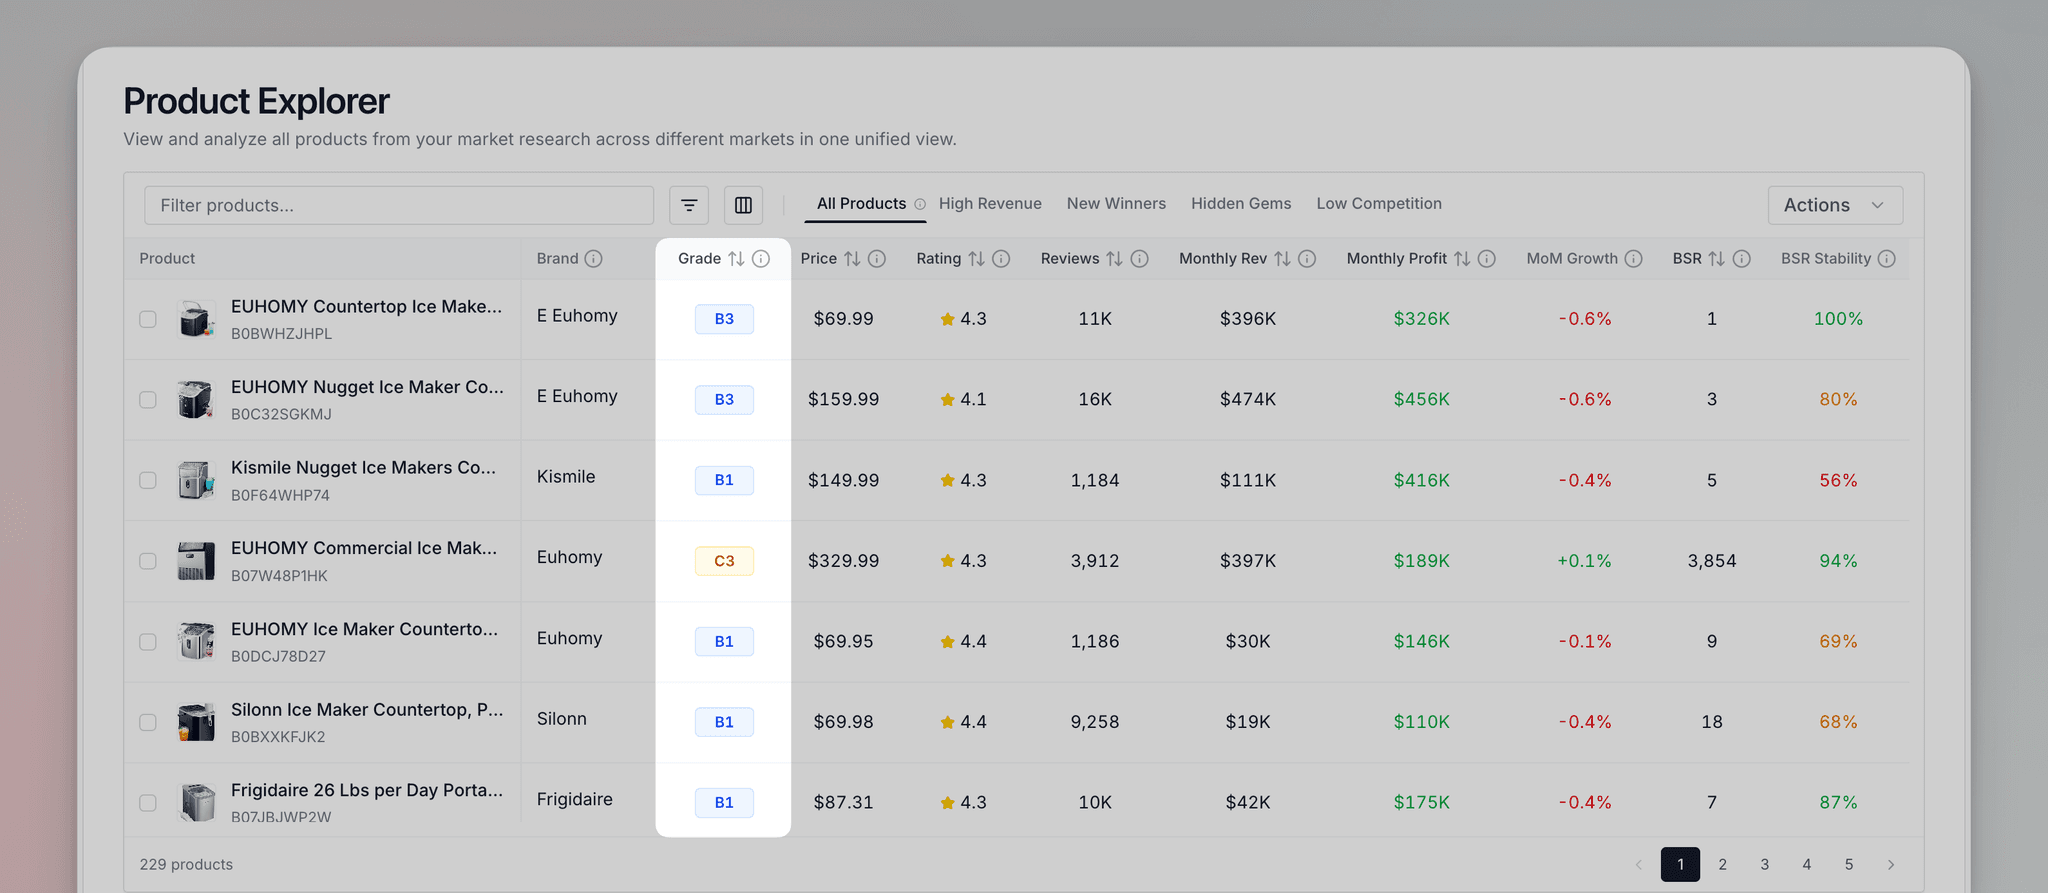
Each individual product also gets a grade. Product grades use the same letter-and-number pattern, but with listing-level metrics instead of market averages.
| Factor | Ideal | Watch | Fail |
|---|---|---|---|
| Revenue | $5K – $100K/mo | $2K – $5K or $100K – $200K | Below $2K or above $200K |
| Price | $20 – $70 | $15 – $20 or $70 – $150 | Below $15 or above $150 |
| Reviews | 0 – 500 | 501 – 1,000 | Over 1,000 |
| BSR | 1 – 100,000 | 100K – 300K | Over 300K |
Launch Fast gives the product letter with the same method as the market letter. The Launch Fast algorithm gives each product number from 1 to 10.
Market Grade vs Product Grade
Two grades, two questions. Start with the market grade. If it looks promising, then check the product grades inside that market.
| Market Grade | Product Grade | |
|---|---|---|
| Where you see it | Market Research dashboard and saved markets | Product Explorer and Market Deep Dive products table |
| What it evaluates | The entire niche (averages across products) | One specific listing |
| Factors | Avg price, avg CPC, review barrier, avg revenue | Revenue, price, reviews, BSR |
| Number | The Launch Fast algorithm gives it | The Launch Fast algorithm gives it |
| Question it answers | Is this niche worth entering? | Is this product a good benchmark or competitor? |
What If a Grade Looks Bad?
A bad grade does not always mean "walk away." It means there is something worth thinking about before you commit. Here is how to evaluate each factor.
The price grade is low — but can you profit with your cost of goods and ad spend? Run the numbers in the Profit Calculator. A lower price point can work if your supplier costs are low enough.
Revenue is low. However, a small market with less competition can work. A large market is not necessary if you can get a sufficient market share. Less revenue frequently means fewer established sellers.
Cost for each click is high — but is your product a high-ticket item? If your margins are strong, the ad cost might be affordable relative to your profit for each sale. High CPC markets sometimes have less competition from smaller sellers.
Lots of competitors have 500+ reviews. It will take longer to build trust. But the market is not off limits. Can you stand out with better images, a sharper price, or an angle competitors have not covered?
The top sellers dominate revenue — but are they actually good? Sometimes dominant sellers have weak listings with bad images or few reviews. Look at their actual pages before you write off the market.
A grade is a starting point, not a final decision. A low grade identifies a factor that you must examine. Your capital, experience, supplier relationships, and risk tolerance also affect the decision.
Best Practices
Get the most out of the grading system with these tips.
Screen markets by grade first. Only dig deeper into markets graded B or above. This saves you from spending hours analyzing markets that have obvious problems.
Do not use the number by itself. Review the market data before you make a decision.
C means one factor is out of range — but which one? A high CPC in a high-ticket market might be fine. Always check what is actually failing before you move on.
A good market grade with weak product grades can be a great sign. It means the niche is healthy but current sellers are not that strong. That is your opportunity.
Frequently Asked Questions
Common questions about how grades work and how to use them.