
Product Research
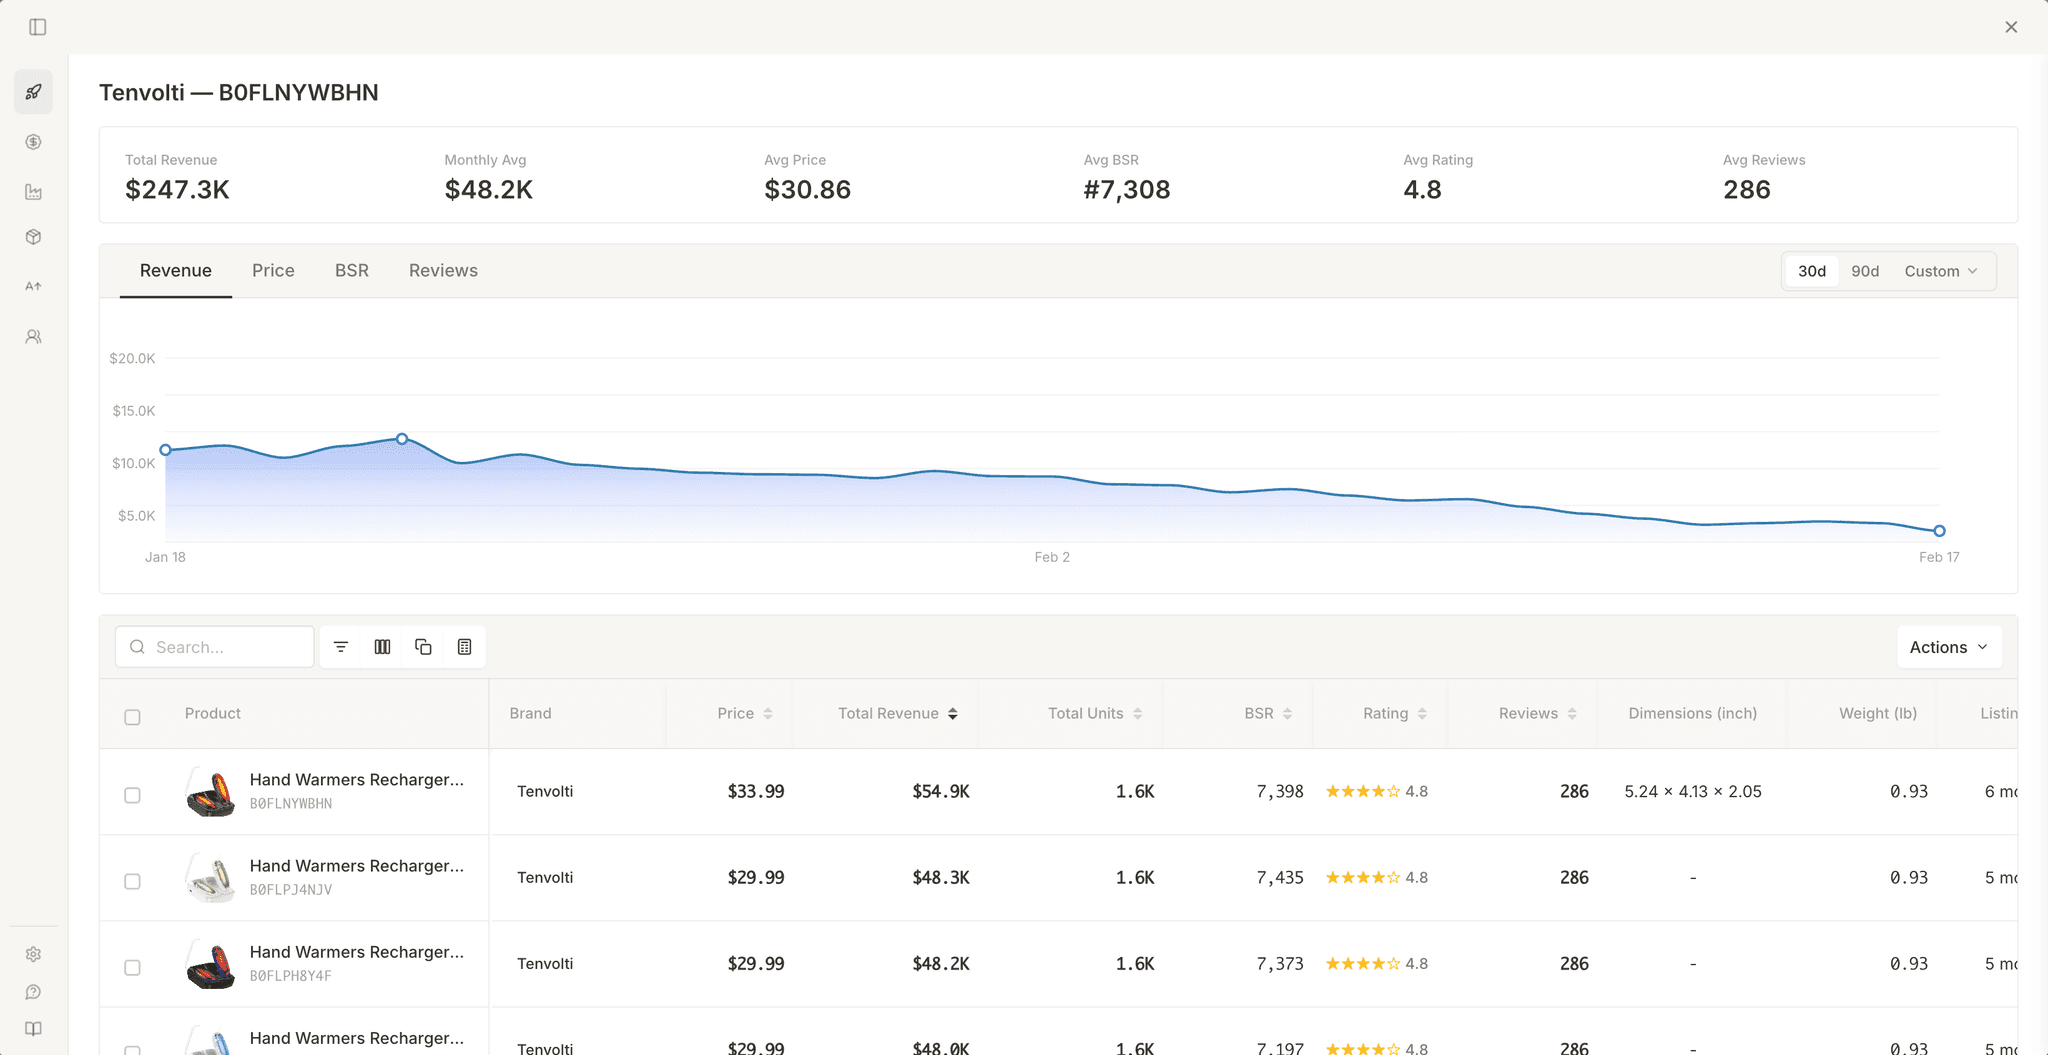
Launch Fast analyzes an Amazon listing when you open it. A banner shows monthly revenue, unit sales, BSR trends, and variations. A product card gives detailed metrics. The dashboard gives charts, a variation table, and a profit calculator.
Overview
Market research evaluates a niche. Product research evaluates one listing and its variations. On an Amazon product page, Launch Fast automatically does three tasks:
- Injects a banner at the top of the page with monthly revenue, units, BSR, and variation count.
- Adds a product card in the right column with detailed product metrics.
- Discovers and enriches variations by finding up to 15 child ASINs and pulling sales data for each.
Use market research to evaluate a keyword and find profitable niches. Use product research to examine a single listing, compare variation performance, and validate profitability with the calculator. Use both.
Product Summary
The banner appears at the top of each product page with four key metrics and trend charts.
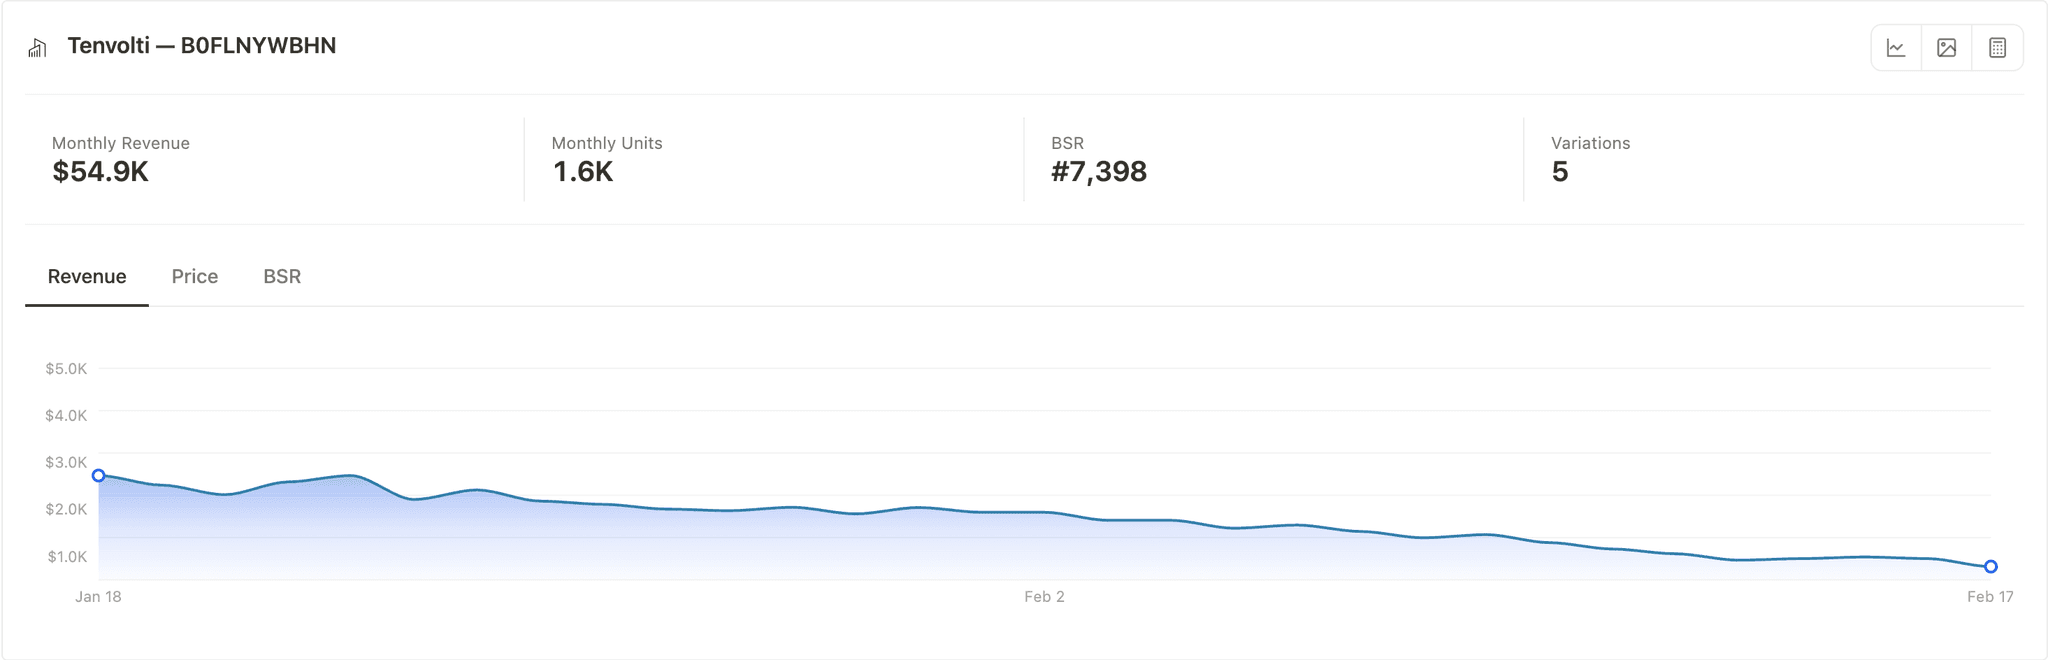
| KPI | Meaning |
|---|---|
| Monthly Revenue | Total revenue over the last 30 days |
| Monthly Units | Total units sold over the last 30 days |
| BSR | Current Best Seller Rank in the product's category |
| Variations | Number of child ASINs discovered (or -- if none) |
Below the KPIs, three chart tabs show historical trends:
| Tab | What it shows |
|---|---|
| Revenue | Daily revenue over the past 30 days |
| Price | Daily price movement over the past 30 days |
| BSR | Daily BSR movement (lower is better) |
Use these to check if revenue, price, and BSR trend up or down before relying on a single data point.
Four action buttons are available on the right side of the banner when data loaded:
| Button | What it does |
|---|---|
| Dashboard | Opens the full modal with the main ASIN plus all variations |
| Image Gallery | Opens a gallery of product and variation images |
| Profit Calculator | Opens the calculator pre-filled with price, dimensions, weight, and category |
| Copy ASINs | Copies the primary ASIN (and available variation ASINs) to quickly paste into other tools |
Banner and product card metrics use a 30-day window ending yesterday, since today's data is frequently incomplete. If a listing has less than 30 days of history, Launch Fast uses all available days. In the Deep Dive Dashboard, you can switch between 30-day and 90-day chart views for a longer view of trend behavior.
ASIN Analysis Card
The product card appears on each ASIN page. Its position is next to or below the buy box, based on the page layout.
Header Actions
| Button | What it does |
|---|---|
| Open Dashboard for ASIN and variations | Opens the modal with the parent ASIN and all enriched variations |
| Open Image Gallery | Opens a gallery of product and variation images |
| Open Profit Calculator | Opens the calculator pre-filled with this product's data |
| Add To Collections | Saves the ASIN to a collection for later comparison |
Data Points
| Category | Data points |
|---|---|
| Seller info | Brand, Seller, and Product Category |
| BSR ranking | BSR-style product rank display |
| Sales data | Monthly Units Sold, Monthly Revenue |
| Fees | Estimated Fees (displayed value from the card) |
| Variations | Number of variations detected |
| Shipping profile | Weight (lbs), dimensions (in), product tier, and fulfillment |
Revenue and units use the same 30-day window as the banner. Products with zero sales are shown as $0.
Variation Analysis
Most Amazon listings have multiple variations. Launch Fast finds and enriches each one so you can size the opportunity correctly.
Landing on the product page
Launch Fast detects the ASIN from the URL and checks cache first. If the product was analyzed in the last 30 days, the banner and product card usually render in under a second.
Discovering variations
The extension identifies child ASINs from variation selectors. Cached variation data loads first. Missing entries stream in from the API. During load, you can see progress like "Enriching variations 3/12."
Viewing variation results
When complete, the variation count updates and the dashboard table includes the parent ASIN plus each variation with separate revenue, units, price, and BSR.
Launch Fast sorts the rows by revenue. The parent ASIN and its child variations appear in one table. Each row gives revenue, units, price, BSR, rating, reviews, dimensions, weight, and listing age.
ASIN Dashboard
Click Dashboard in the banner toolbar. The dashboard uses the market research layout and focuses on the listing.
| KPI | What it shows |
|---|---|
| Total Revenue | Combined revenue across main ASIN plus all variations |
| Monthly Avg | Average revenue for each ASIN |
| Avg Price | Average price across all ASINs |
| Avg BSR | Average BSR across the ASINs |
| Avg Rating | Average review rating across the ASINs |
| Avg Reviews | Average review count across the ASINs |
Charts
Available Chart Tabs
| Chart tab | Shows |
|---|---|
| Revenue | 30-day revenue trend across the main ASIN and variations |
| Price | 30-day price trend and movement |
| BSR | 30-day BSR trend |
Product table
Columns
| Column | Description |
|---|---|
| Brand | Product brand |
| Price | Current price |
| Total Revenue | Monthly revenue |
| Total Units | Monthly units |
| BSR | Best Seller Rank |
| Rating | Average star rating |
| Reviews | Review count |
| Dimensions (inch) | Product dimensions |
| Weight (lb) | Product weight |
| Listing Age | Time since listing |
Best Practices
Use these habits to evaluate products more accurately.
- Check variation performance before acting. A listing can show healthy market-level revenue, but one or two variations can drive most sales.
- Use the product card and dashboard together. The product card is your first pass. The dashboard is where you validate variation consistency.
- Keep the calculator realistic. Use a practical COGS value and realistic shipping assumptions before committing.
- Use the same workflow for multiple listings. Run product research on a few strong candidates before moving to sourcing.
Frequently Asked Questions
Common questions about single-ASIN analysis.