
Grading System
Launch Fast gives each market and product a grade such as B7 or A10. The letter shows opportunity strength. The Launch Fast algorithm gives each number from 1 to 10. Use grades to scan many markets quickly.
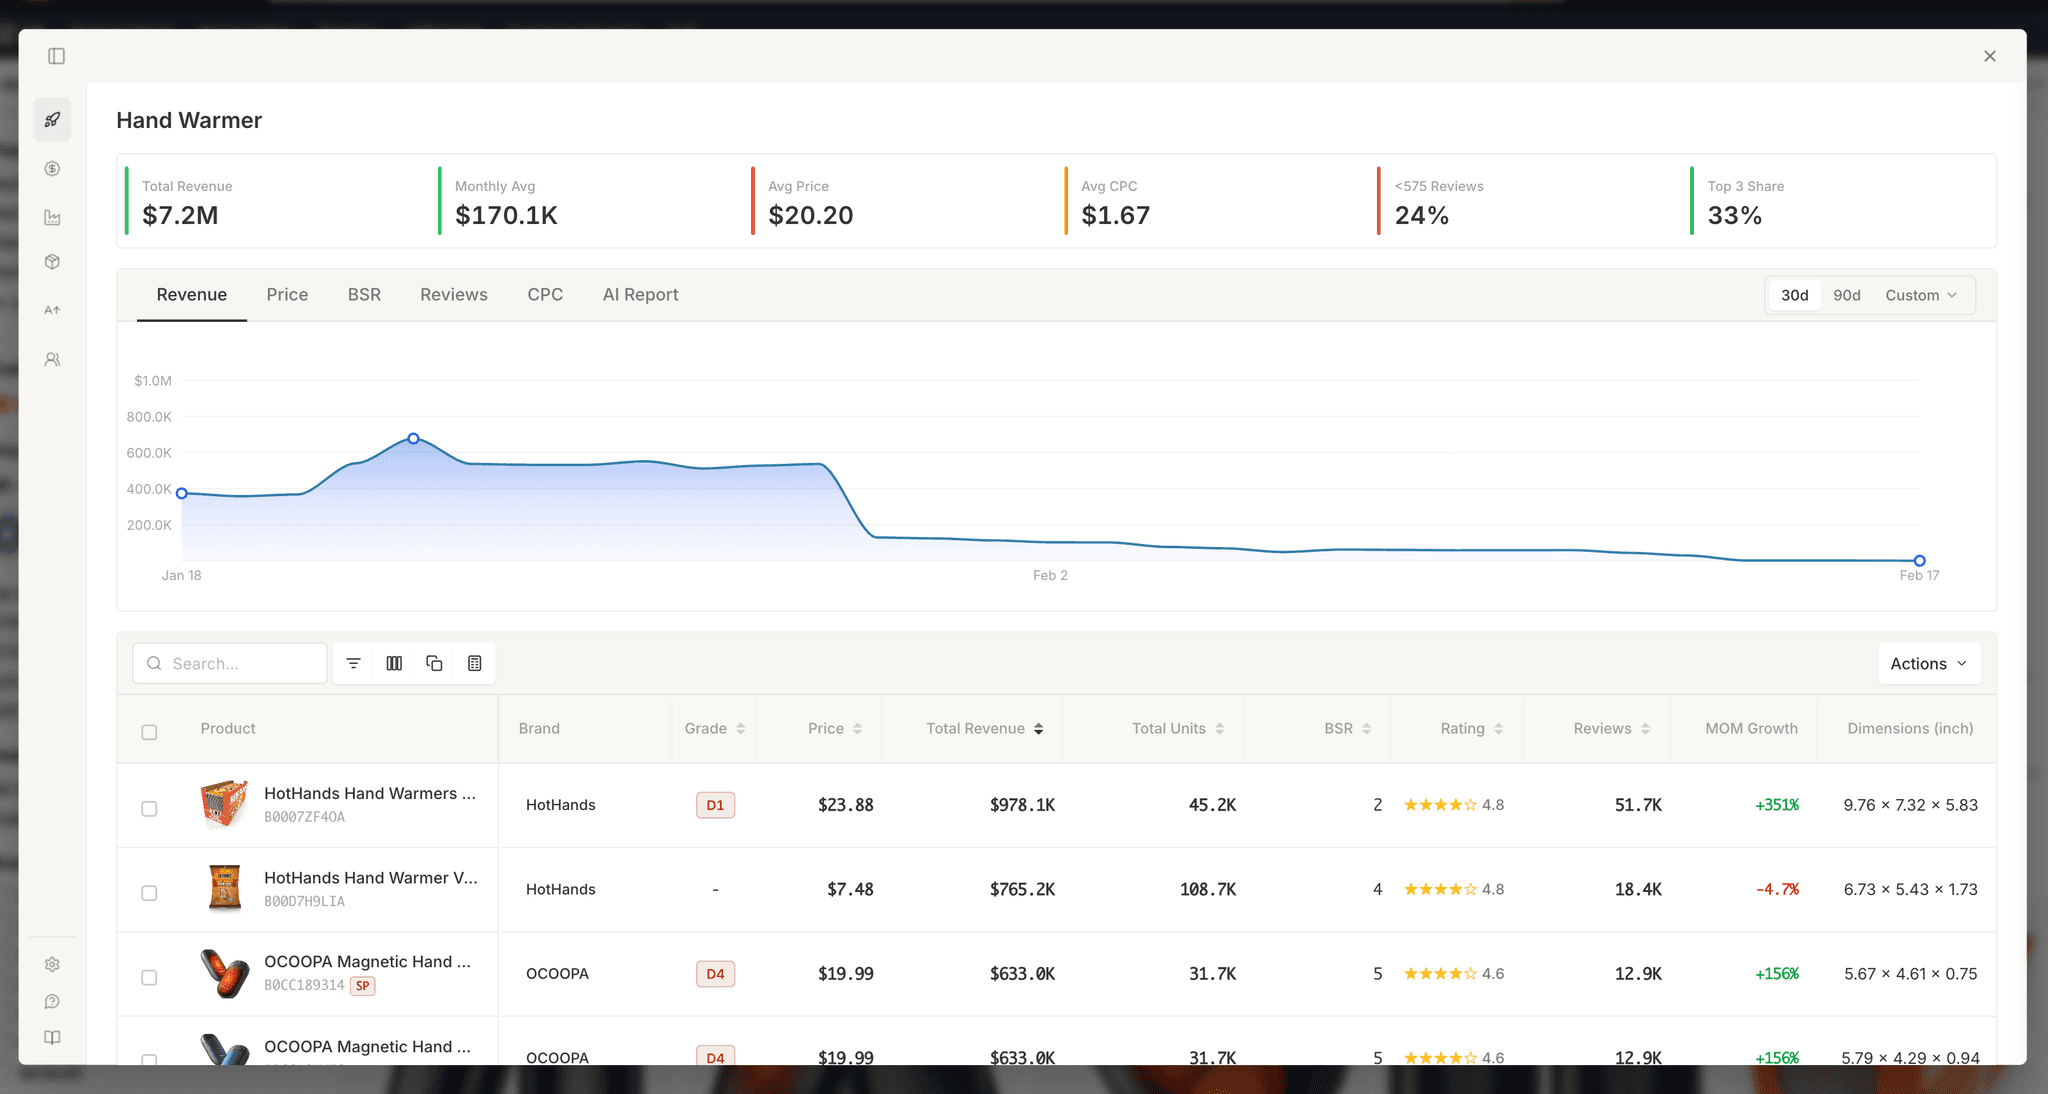
Overview
Researching Amazon markets means reading many signals across many products. Grades collapse that into a quick score so you can decide what to investigate next.
Each grade has two parts:
- A letter (A through F): how well the market or product scores across key factors. A is strong, F is usually not worth the time.
- A number (1 through 10): The Launch Fast algorithm gives this number.
When you search "yoga mat" and see B7 on the banner, the letter shows that the market is strong for most factors. Use the grade as a signal to open the products list and the Deep Dive Dashboard.
Grades help you scan and filter fast. They are not your final call. Check the actual Deep Dive Dashboard data before you decide.
Market Grades
The market grade appears on the banner when you search a keyword on Amazon. It evaluates the entire niche, not a single product.
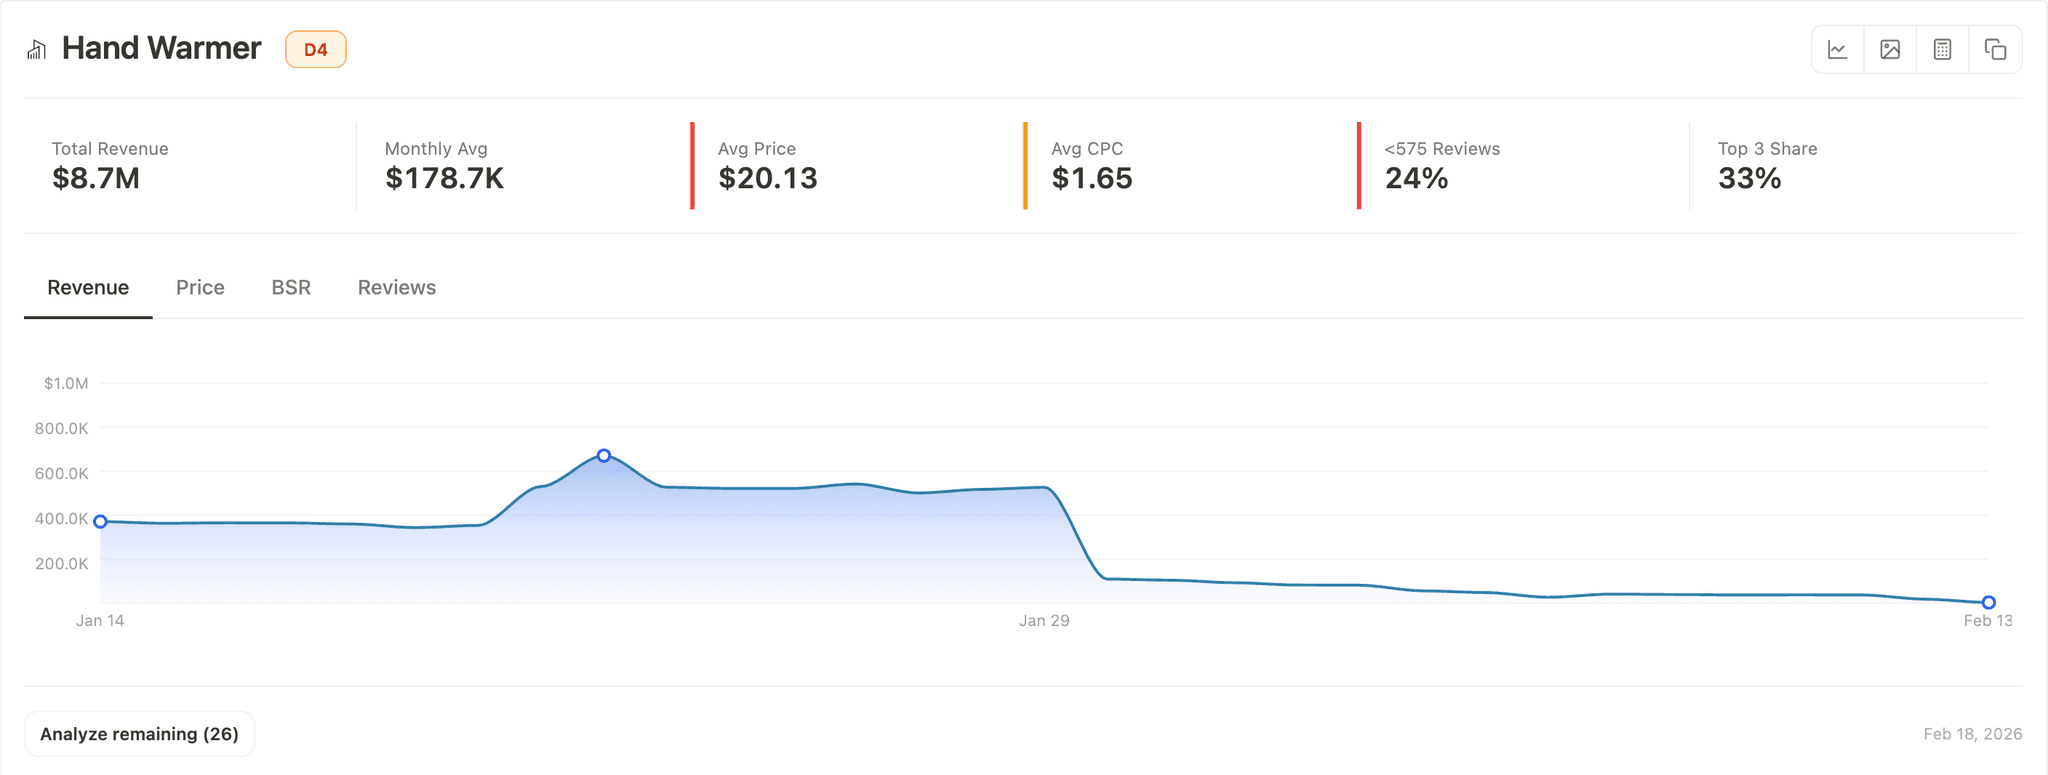
What Gets Evaluated
Launch Fast checks four metrics across all the products in the search results. Each metric is scored as ideal, watch, or fail.
| Factor | What it measures | Ideal | Watch | Fail |
|---|---|---|---|---|
| Average Price | Typical selling price in the niche | $50 – $250 | $30 – $50 or $250 – $300 | Below $30 or above $300 |
| Average CPC | Cost for each click for advertising | Under $1.00 | $1.00 – $2.00 | Over $2.00 |
| Review Barrier | % of sellers with under 575 reviews | Over 50% under 575 | 30% – 50% under 575 | Under 30% |
| Average Revenue | Typical monthly revenue for each product | $25K – $1M | $5K – $25K or $1M – $1.5M | Below $5K or above $1.5M |
Launch Fast also measures market concentration. Review this metric separately from the grade.
How the Letter is Determined
The letter grade is based on how many factors fail.
| Grade | What it means | How to interpret |
|---|---|---|
| A10 | All factors ideal | Each metric is in the ideal range. Pricing, CPC, reviews, and revenue are favorable. |
| B10 | No fails, some watch | No hard blockers, but one or more metrics are borderline. Most opportunities land here. |
| C10 | One factor fails | One important signal is off. A single fail can be meaningful depending on which metric missed the range. |
| D10 | Two factors fail | Two metrics are weak. You usually must have a clear advantage to continue. |
| F1 | Three or more factors fail | Multiple red flags across key factors. Usually skip unless you have a strong reason to test quickly. |
How Launch Fast Gives the Number
The Launch Fast algorithm gives each number from 1 to 10.
Why These Thresholds?
The ranges are calibrated for private label sellers entering Amazon. Here is the reasoning behind each factor.
-
Average Price: $50–$250 ideal
- Markets below $30 average frequently have tight margins after fees and ads.
- Above $300, unit volume usually drops and capital requirements rise.
- The $50–$250 range usually gives the best balance of margin, demand, and scaling.
-
Average CPC: Under $1.00 ideal
- CPC is your cost to acquire visibility.
- Under $1.00 usually supports profitable launches.
- Over $2.00 can drain margins unless your listings convert exceptionally well.
-
Review Barrier: Over 50% under 575 reviews ideal
- When most sellers have fewer than 575 reviews, new entrants frequently have more room to win.
- If under 30% are below that threshold, incumbents tend to control trust and sales history.
-
Average Revenue: $25K–$1M ideal
- Below $5K average can be too small for sustainable testing.
- Above $1.5M frequently indicates heavy competition and higher capital intensity.
Product Grades
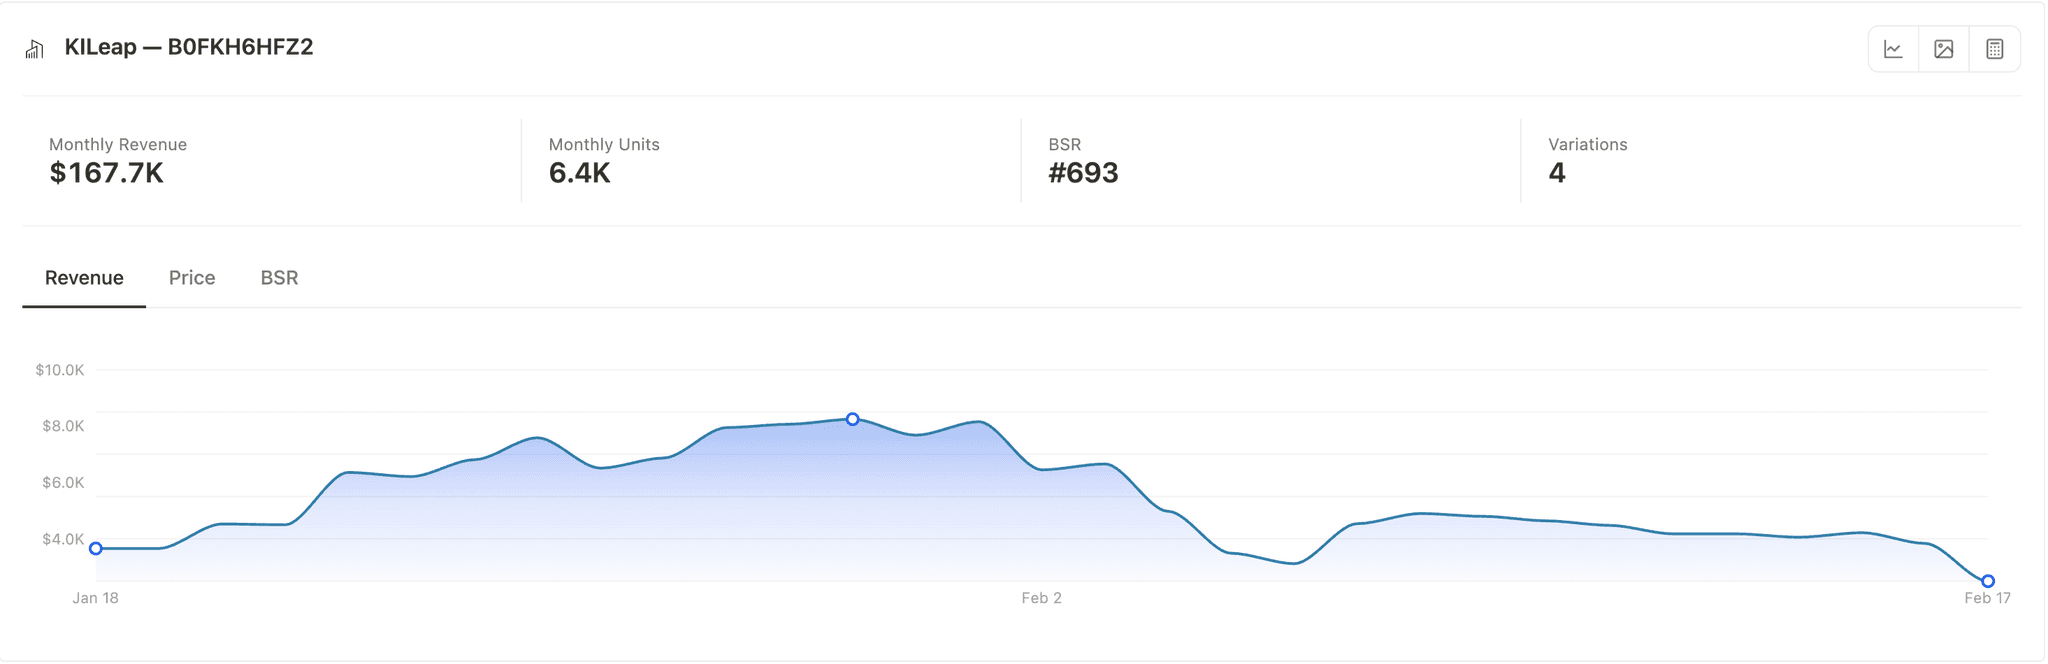
Inside the Deep Dive Dashboard and on product cards, each listing gets a grade. Product grades use the same letter-and-number pattern, with listing-level metrics. Product grades check these metrics:
| Factor | Ideal | Watch | Fail |
|---|---|---|---|
| Revenue | $5K – $100K/mo | $2K – $5K or $100K – $200K | Below $2K or above $200K |
| Price | $20 – $70 | $15 – $20 or $70 – $150 | Below $15 or above $150 |
| Reviews | 0 – 500 | 501 – 1,000 | Over 1,000 |
| BSR | 1 – 100,000 | 100K – 300K | Over 300K |
Launch Fast gives the product letter with the same method as the market letter. The Launch Fast algorithm gives each product number from 1 to 10.
Market Grade vs Product Grade
Two grades, two questions. Use both together. Start with the market grade. If it is B or above, then evaluate product grades inside that market.
| Market Grade | Product Grade | |
|---|---|---|
| Where | Deep Dive Dashboard header | Insert cards, product table |
| Evaluates | The entire niche (averages across products) | One specific listing |
| Factors | Avg price, avg CPC, review barrier, avg revenue | Revenue, price, reviews, BSR |
| Number | The Launch Fast algorithm gives it | The Launch Fast algorithm gives it |
| Answers | Is this niche worth entering? | Is this product a good benchmark? |
Best Practices
Use grades to narrow your research:
- Screen markets first, then open the Deep Dive Dashboard for B+ markets only.
- B grades are frequently the best opportunity zone.
- Review the full grade and the market data.
- Understand the failing factor before rejecting a C-grade option.
Frequently Asked Questions
Common questions about grades and how to use them in research.