
Market Research
Search a keyword on Amazon. Launch Fast analyzes revenue, prices, competition, and ad costs on the first page. Results appear in a summary banner, product cards, and a dashboard.
Overview
Market research is the core workflow in Launch Fast. Each Amazon search you run becomes an instant market analysis.
When you search a keyword on Amazon, Launch Fast does three things automatically:
- Injects a summary banner above the search results with market-level KPIs and a grade
- Adds data cards to each product listing with revenue, units, BSR, and grade
- Prepares a full dashboard you can open for charts, tables, and deeper analysis
The banner and product cards appear as soon as the first batch of products is analyzed (2–5 seconds). The full product table in the modal can take up to 2 minutes if there are many products. You can open the modal immediately. Data populates as it arrives.
The Research Flow
Four steps from keyword to market data.
Search a keyword on Amazon
Go to an Amazon marketplace and search a keyword, for example "hand warmer", "yoga mat", or "dog leash". Launch Fast activates automatically on each search results page.
Read the summary banner
A banner appears above the first search result showing six market KPIs and the market grade. This is your first-pass filter. If the grade is D or F, you can move on to the next keyword without opening anything.
Scan the product cards
Each product listing now has an inline product card showing monthly revenue, units sold, profit for each unit, and grade. Scroll through the results to quickly spot the top performers.
Open the dashboard
Click the chart icon on the banner or a product card to open the full dashboard modal. Here you get charts, a sortable product table, AI-generated reports, a profit calculator, and export tools.
Summary Banner
The banner appears above the first search result and shows six KPIs alongside the market grade badge.
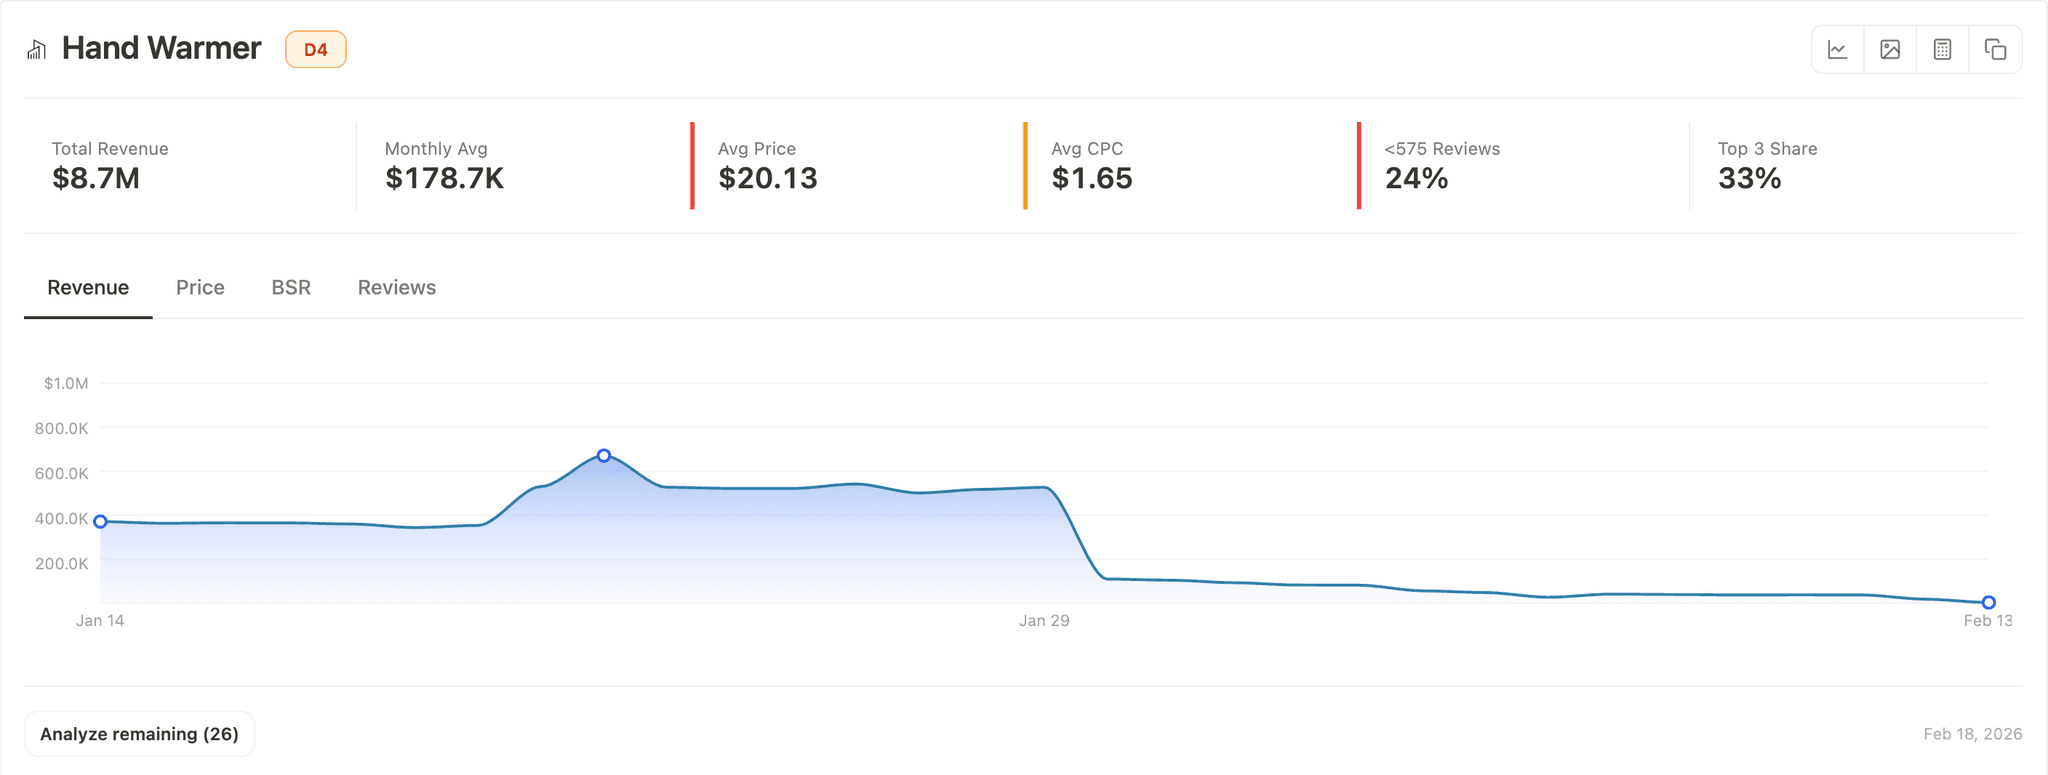
| KPI | Meaning |
|---|---|
| Total Revenue | Combined 30-day revenue across all analyzed products |
| Monthly Avg | Average revenue for each product for each month |
| Avg Price | Average listing price across all products |
| Avg CPC | Average cost for each click for this keyword |
| <575 Reviews | Percentage of products with fewer than 575 reviews (low barrier) |
| Top 3 Share | Revenue share held by the top 3 sellers (market concentration) |
Each KPI has a colored status indicator, green (ideal), amber (watch), or red (fail), matching the thresholds from the grading system. The market grade badge sits at the top-right corner of the banner.
These KPIs give context for the market letter:
- The market letter uses Avg Price, Avg CPC, <575 Reviews, and Monthly Avg. The Launch Fast algorithm gives the number.
- Total Revenue and Top 3 Share provide additional context for opportunity and concentration.
- See the Grading System section for scoring details.
Product Cards
Each product on the search results page gets an inline product card with key metrics. You do not have to open each listing.
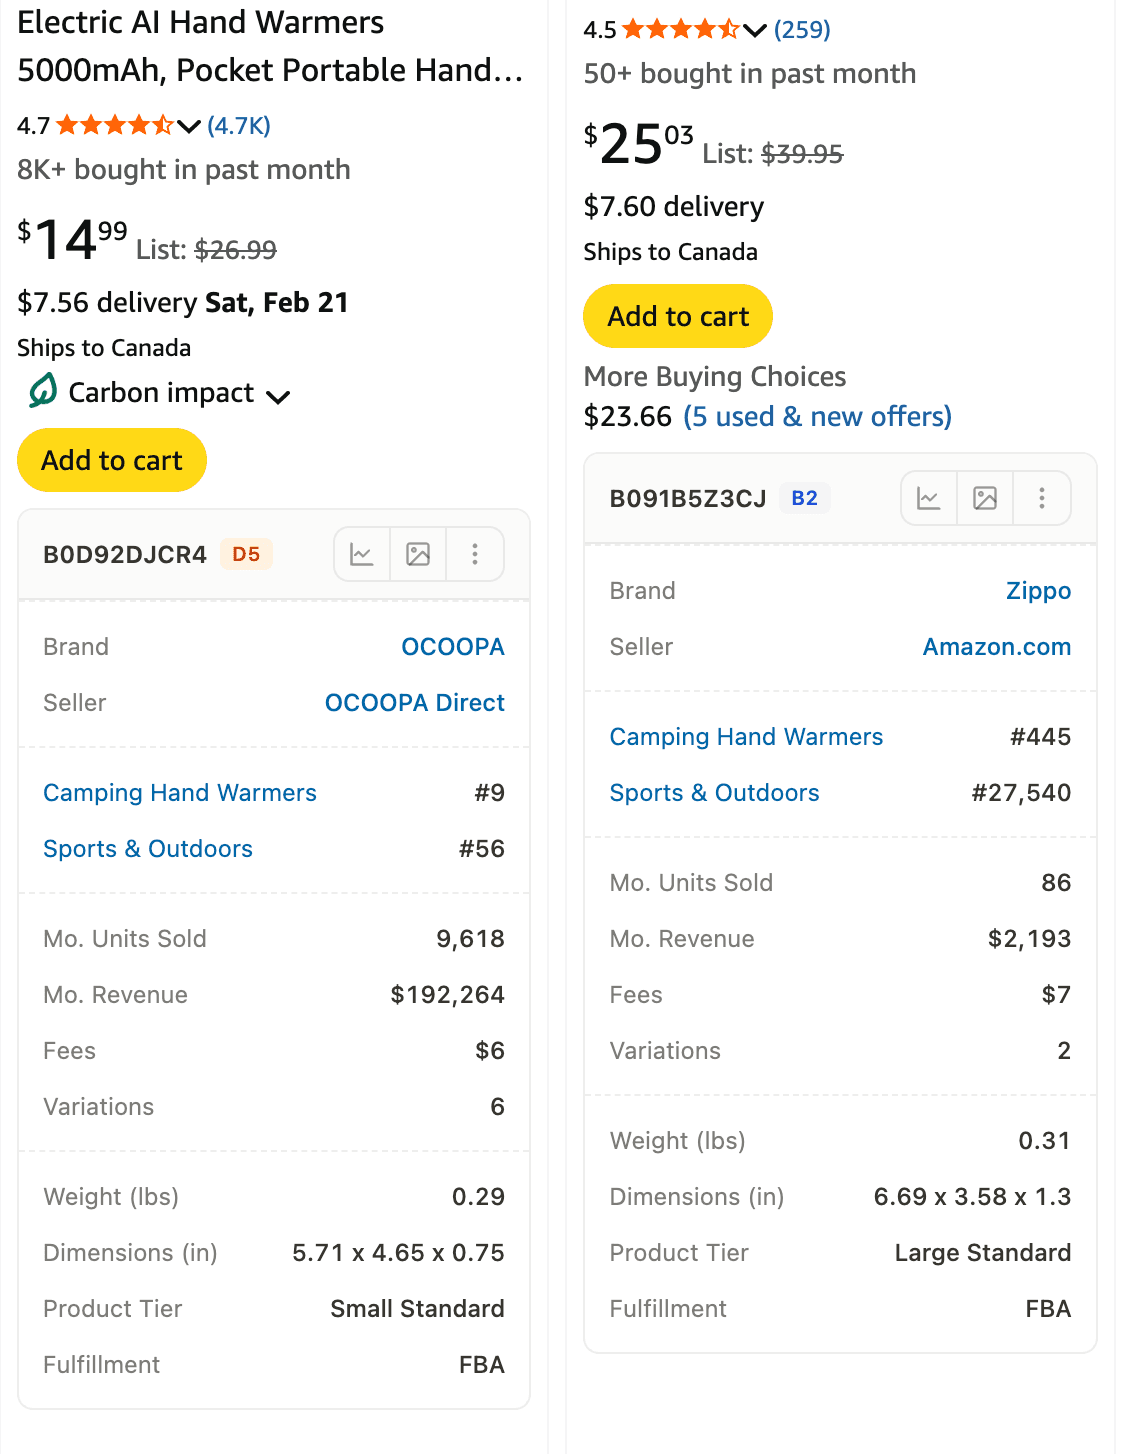
Product cards appear below each Amazon product listing and show:
-
Sales data
- Monthly revenue
- Monthly units sold
- Profit for each unit
-
Product details
- Product grade (color-coded badge)
- BSR + category
- Dimensions and weight
- Listing age
Click the chart icon on a product card to open the dashboard modal with that product highlighted in the table.
Cards that show "No sales data available" mean the product is too new for revenue estimates or was rate-limited during data collection. These products appear in the dashboard modal but will not have revenue or unit data.
The Dashboard
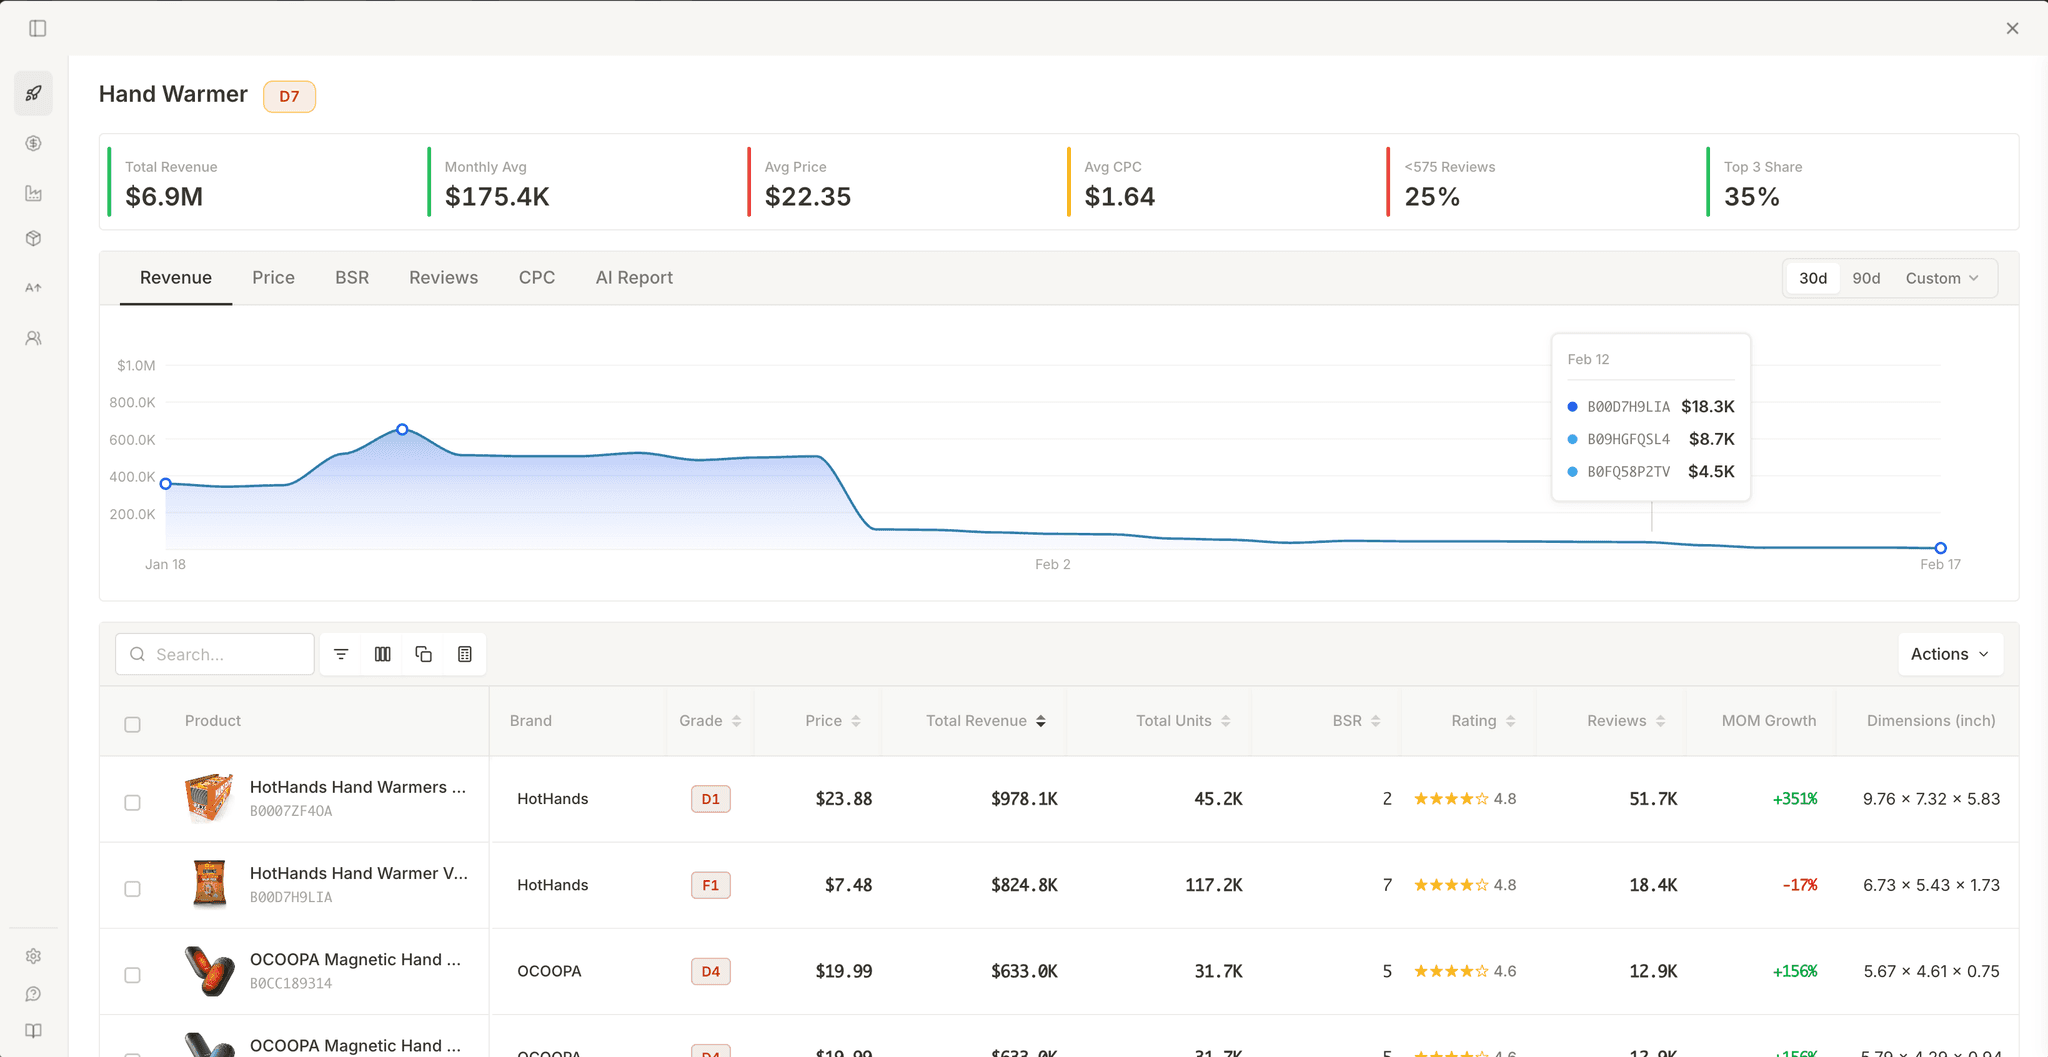
Click the chart icon on the banner or a product card to open the dashboard. The layout has three areas:
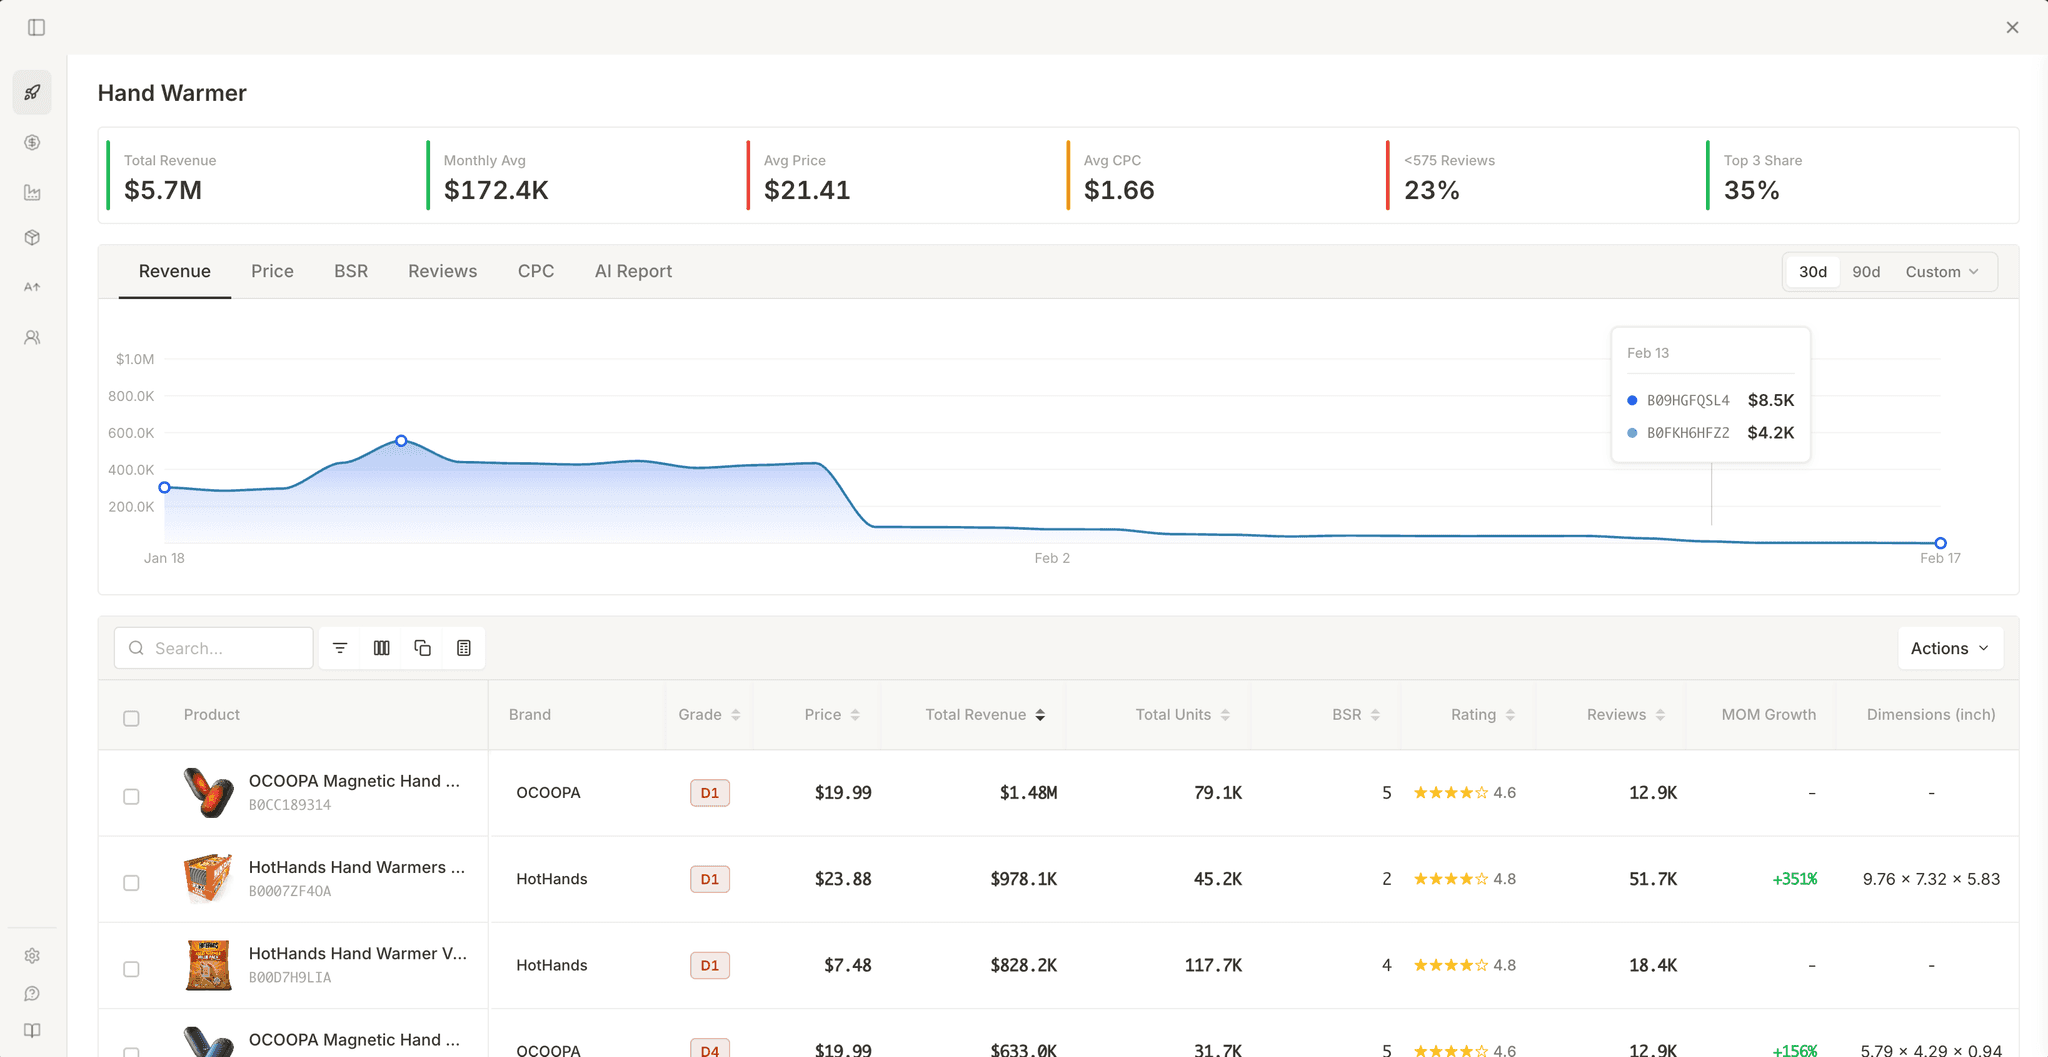
-
KPI strip
Six metrics across the top with colored status indicators. These update as data loads and change with product selection. -
Chart area
Revenue, Price, BSR, and Reviews are switchable. A date range selector appears in the top-right. -
Product table
Full product metrics with sort/filter controls and comparison checkboxes.
KPI Strip
The six KPIs shown in market overview mode (no products selected):

| KPI | What it measures | Status indicator |
|---|---|---|
| Total Revenue | Combined 30-day revenue for all products | Green above $1.5M, amber above $300K, red below |
| Monthly Avg | Average monthly revenue for each product | Green above $10K, amber above $5K, red below |
| Avg Price | Average listing price | Green $50–$250, amber $30–$50 or $250–$300, red outside |
| Avg CPC | Average cost for each click | Green under $1.00, amber $1–$2, red above $2 |
| <575 Reviews | % of products under 575 reviews | Green above 50%, amber 30–50%, red below 30% |
| Top 3 Share | Revenue share of top 3 sellers | Green under 50%, amber 50–70%, red above 70% |
Each KPI has a green, amber, or red line. Use these lines to quickly examine the market condition.
Market Charts
Four chart views covering revenue, pricing, BSR, and reviews.
-
Revenue chart: Historical line graph showing daily sales across all products. Use the date range selector (top-right) to switch between 30-day, 90-day, or custom ranges.
-
Price chart: Historical line graph showing the daily average price across products. Helps you identify the main price band and spot trends over time. Affected by date range selection.
-
BSR chart: Historical line graph showing the daily average BSR across all products. Affected by date range selection.
-
Reviews chart: Bar chart showing review count ranges vs product revenue. Quickly reveals if high-review incumbents dominate revenue or if lower-review products compete. Not affected by date range.
Use the selector at the top-right of the chart area. Select 30 days, 90 days, or a custom range. The custom picker lets you select accurate start and end dates. Revenue, Price, and BSR charts update for the selected period. Reviews are not affected by date range.
AI Market Report
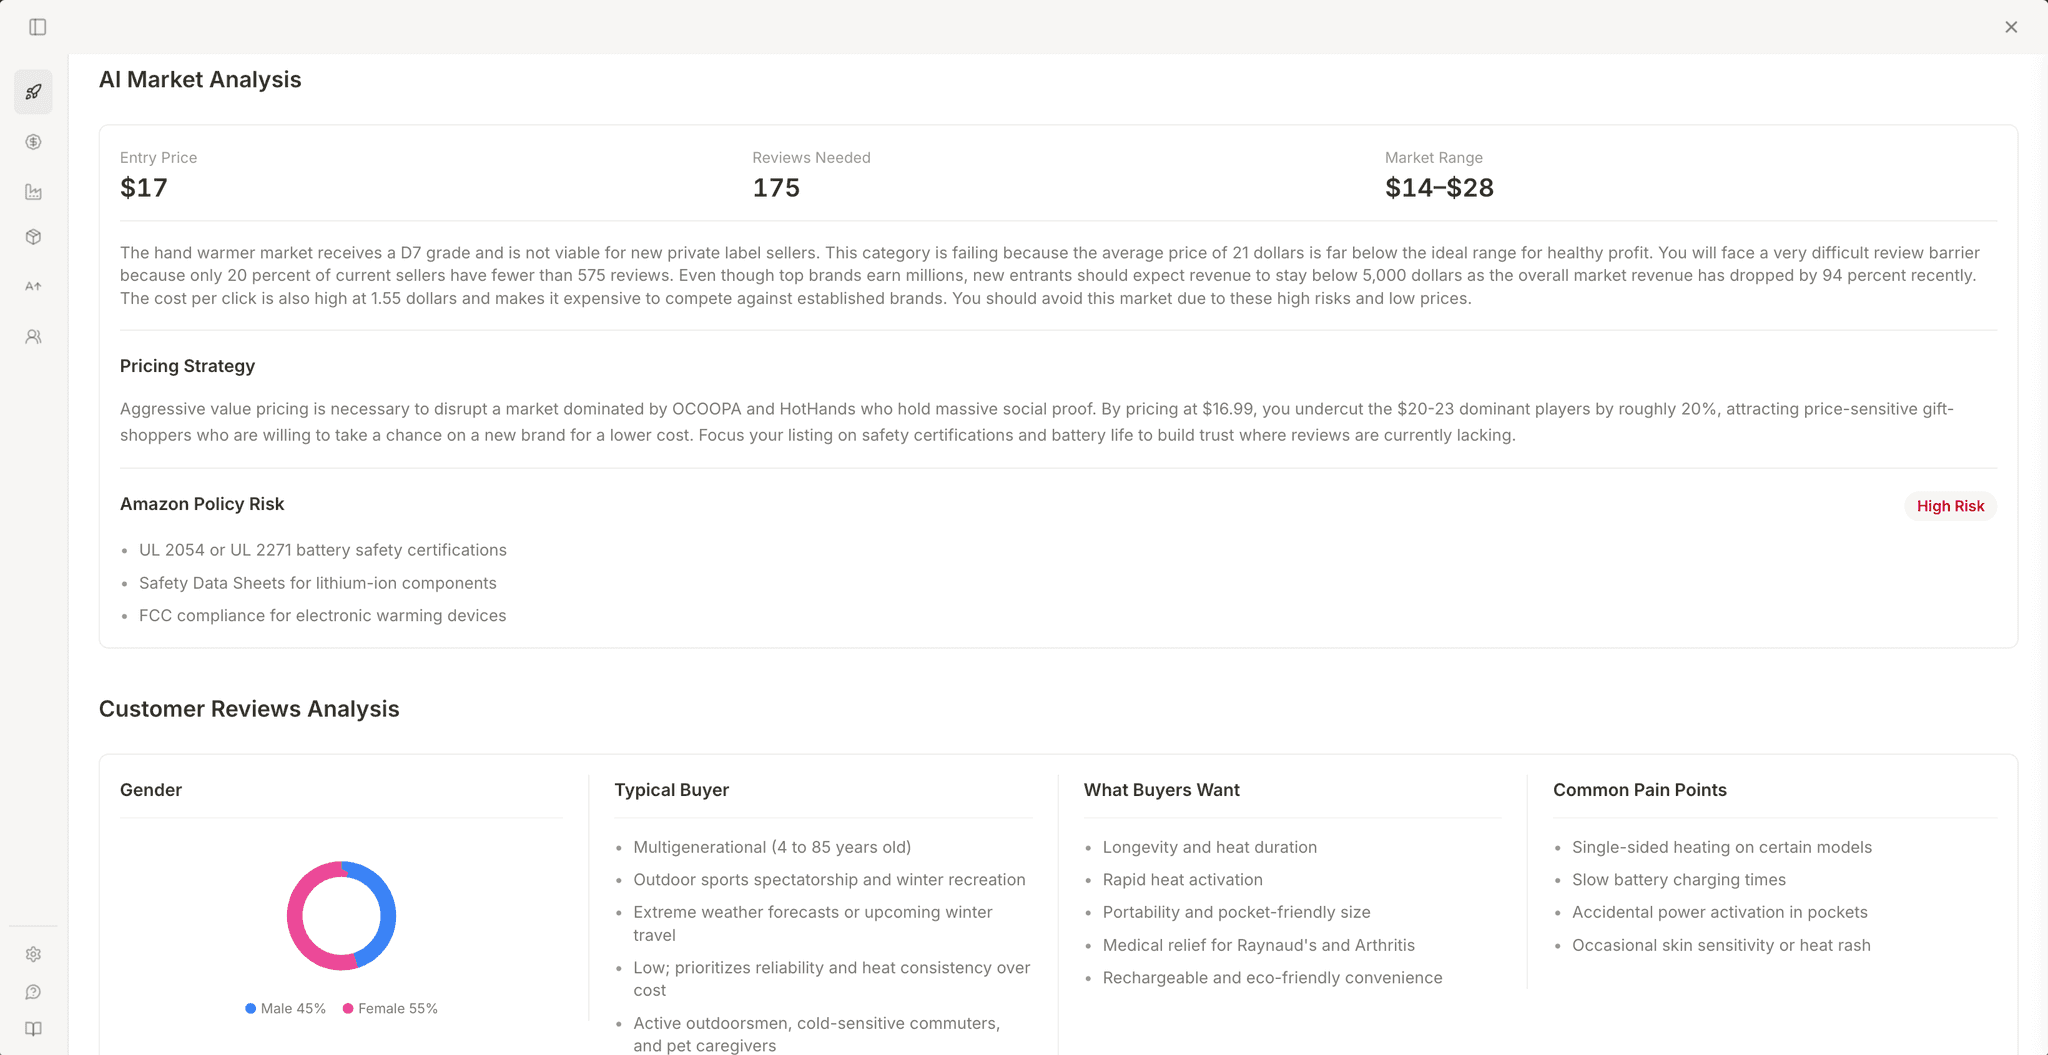
Click the AI Report button in the chart tab bar to generate a market analysis. The report takes about 60 seconds and replaces the product table with three sections:
-
AI Market Analysis
- Three headline metrics: recommended entry price, reviews needed to compete, and market price range.
- Written market analysis and pricing strategy recommendation.
- Amazon policy risk assessment with level and contributing risk factors.
-
Customer Reviews Analysis
- Gender split chart.
- Typical buyer profile with demographics and use cases.
- Purchase motivators and recurring pain points.
- Helps identify who buys in this niche and what they care about.
-
PPC Analysis
- AI-generated keyword campaign table: top keywords with search volume, CPC, and bid ranges.
- Product targeting recommendations to identify top competitors and easier-to-win targets (revenue but low reviews).
While the report generates, the 30-day revenue chart stays visible above the report sections. A progress indicator shows the current phase until generation completes.
Reports use your monthly AI quota of 100 uses, shared across all AI features in the extension and webapp. A progress bar in the generation dialog shows how many you used. If you have generated a report for this keyword, it loads instantly from cache instead of using another credit.
Product Table
Below the chart area, the product table lists all analyzed products. Default sort is Total Revenue (descending). Each row has a checkbox for selecting products: select 1 to see individual metrics, or 2–3 for a comparison view.
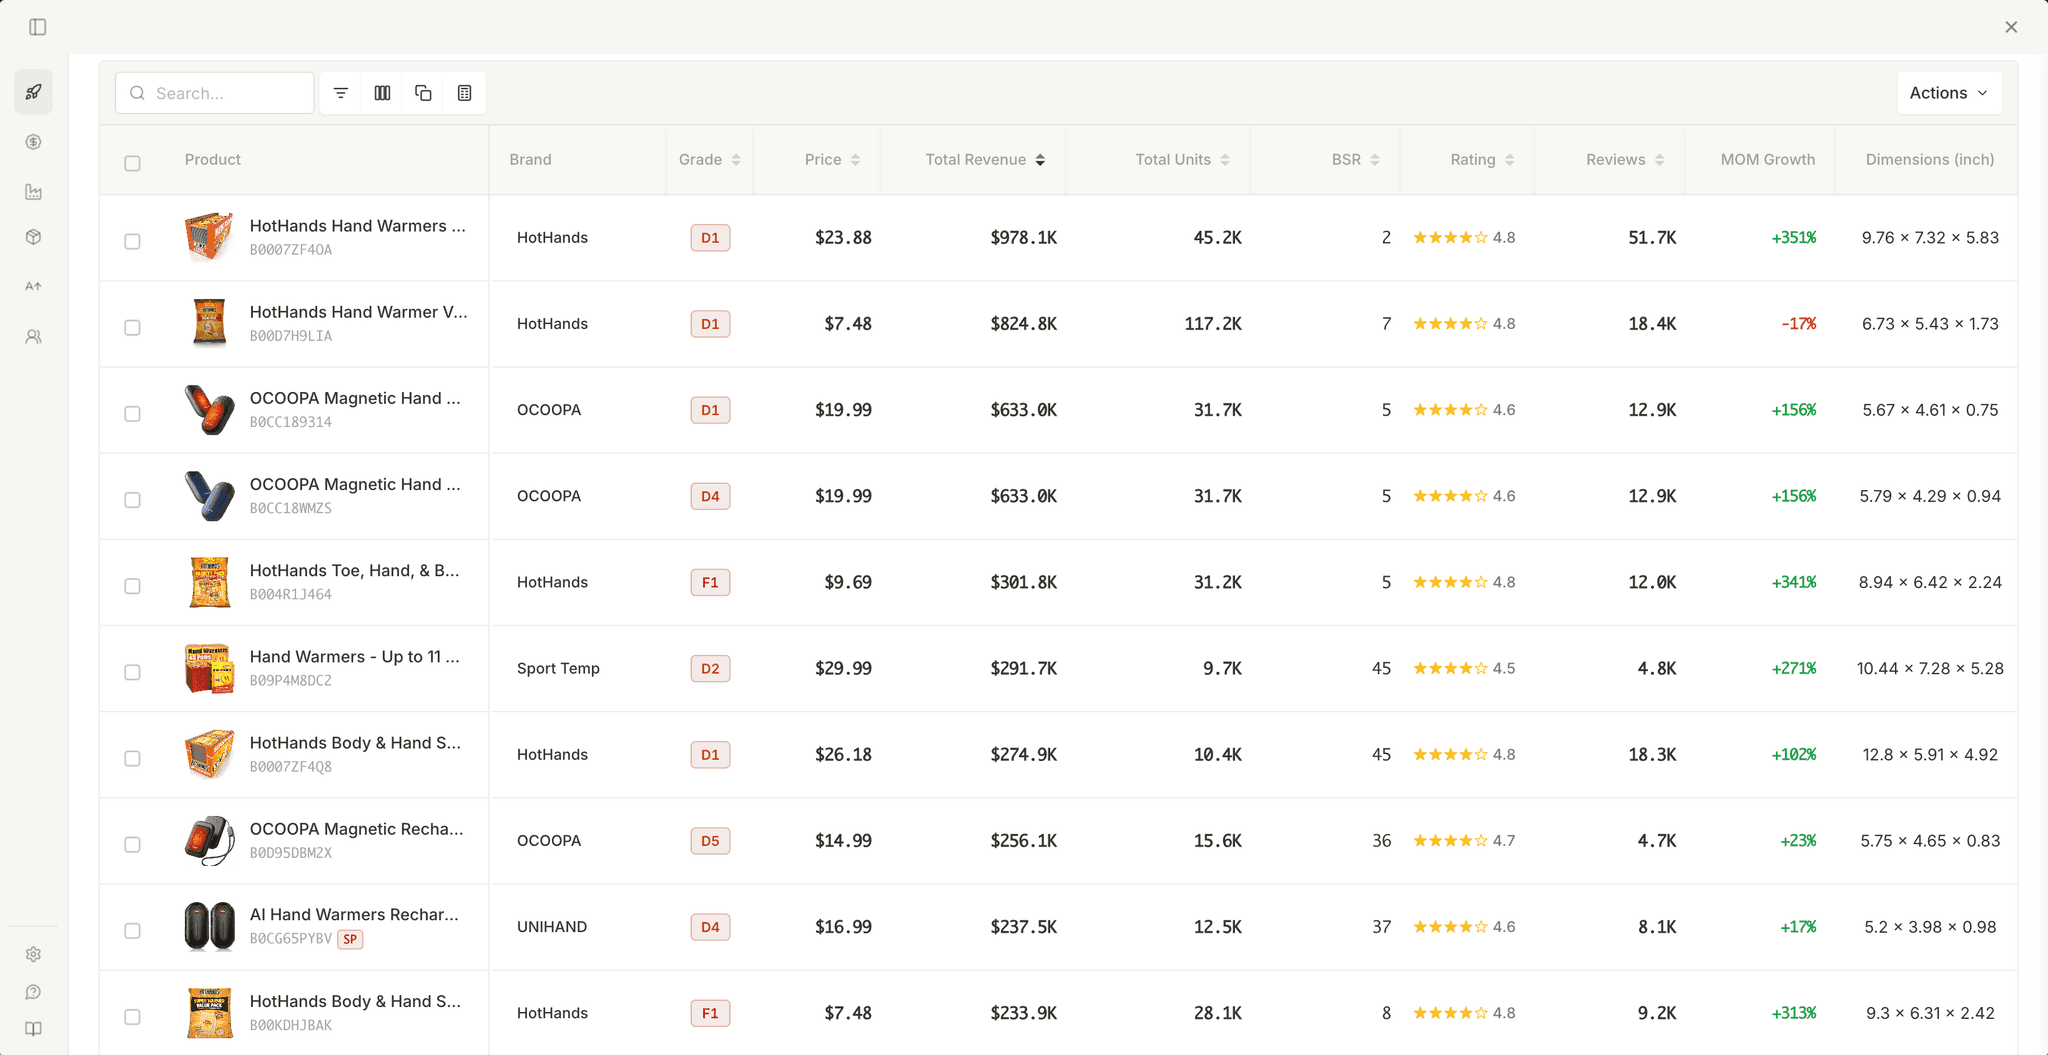
| Column | Data | Sortable |
|---|---|---|
| Product | Image + title + ASIN (sponsored products show "SP" badge) | Static |
| Brand | Seller brand name | Static |
| Grade | A10–F1 color-coded badge | Yes |
| Price | Current listing price | Yes |
| Total Revenue | Monthly revenue | Yes |
| Total Units | Monthly units sold | Yes |
| BSR | Best Seller Rank | Yes |
| Rating | Star rating (1–5) | Yes |
| Reviews | Review count | Yes |
| MOM Growth | Month-over-month growth % (green = up, red = down) | Static |
| Dimensions | Length x Width x Height (inches) | Static |
| Weight | Weight in pounds | Static |
| Listing Age | Time since listing appeared | Static |
Product Selection
Select products in the table to compare them directly. KPIs and charts adapt to show what you selected.
Select one product by clicking its checkbox. The dashboard switches to product detail mode:
KPIs change to:
| KPI | What it shows |
|---|---|
| Revenue | This product's monthly revenue |
| Units Sold | This product's monthly units |
| Price | This product's price |
| Market Share | This product's share of total market revenue |
Charts show: Revenue, Price, and BSR history for the selected product over time.
Use this view to compare a product with its market. See if the product metrics increase or decrease.
Select 2–3 products to compare them side by side. The dashboard switches to comparison mode:
KPIs change to:
| KPI | What it shows |
|---|---|
| Combined Revenue | Total revenue of selected products |
| Combined Units | Total units of selected products |
| Avg Price | Average price across selected products |
| Combined Share | Selected products' share of total market revenue |
Charts show: Revenue, Price, and BSR for each selected product as overlapping series, making trends easy to compare visually.
Maximum 3 products can be selected at the same time. Deselect all to return to market overview mode.
Filters
Narrow down the product table to focus on the products that matter.
The toolbar above the product table has filter controls:
Quick toggles:
- Hide Sponsored removes products with the "SP" badge so you only see organic listings
- New Sellers Only shows only products with listing age under 6 months
Advanced filters (click the filter icon):
| Filter | Range |
|---|---|
| Monthly Revenue | Min – Max ($) |
| Price | Min – Max ($) |
| Reviews | Min – Max |
| Rating | Min – Max |
| BSR | Min – Max |
| Monthly Units | Min – Max |
| Listing Age | Min – Max (days) |
Filters affect the product table, KPIs, and charts. Everything recalculates based on the filtered set.
When products are selected for comparison, the filter button is disabled. Deselect all products to re-enable filtering.
Profit Calculator
Click the calculator icon in the toolbar to open a side panel. It auto-fills from the selected product or market averages. All fields update in real time. For a detailed walkthrough, see Profit Calculator.
| Field | Type | Description |
|---|---|---|
| Product Price | Editable | Current listing price |
| COGS | Editable | Cost of goods sold for each unit |
| Shipping Cost | Editable | Auto-estimated from weight, overridable |
| Category | Editable | Searchable dropdown, determines referral and fulfillment fees |
| PPC Cost for Each Sale | Editable | Advertising cost for each unit |
| Referral Fee | Auto-calculated | Based on category and price |
| FBA Fulfillment Fee | Auto-calculated | Based on category and dimensions |
| Storage Fees | Auto-calculated | Jan–Sep and Oct–Dec rates |
| Net Profit | Output | Final profit for each unit after all costs |
Exports
The Actions dropdown in the toolbar has three export options:
-
Export to Excel (
.xlsx)- Downloads the full product table as a spreadsheet.
- Keeps current filters and sorting.
- Open in Excel or Google Sheets for deeper analysis.
-
Screenshot (
.png)- Captures current modal view (KPIs, active chart, table) as one image.
- Useful for sharing market snapshots with partners or saving for comparison.
-
Export Images (
.zip)- Downloads product images from visible table rows as a ZIP archive.
- Useful for listing research and competitor image-reference checks.
All exports respect current filters. If you hidden sponsored products or filtered by price range, only the visible products are included.
Best Practices
Use the research signals to avoid noise and stay focused:
- Search 10–20 keywords for each session. Check the banner grade first, then open the dashboard mainly for B+ markets.
- Wait for full data before you conclude. The banner appears quickly. The modal table can load for larger searches.
- Use filters to test hypotheses. Remove sponsored results, narrow price bands, and review listing age to stress-test a market before comparing top candidates.
- Always run the profit calculator with realistic COGS before you shortlist. Strong revenue and low CPC can fail margins after fees.
Frequently Asked Questions
Common questions about market research.
Grading System
Learn how Launch Fast grades Amazon markets and products with letter-number scores. Learn how to use grades to find profitable opportunities.
Product Research
Visit an Amazon product page to see revenue, units, BSR history, and variation breakdowns in a banner, product card, and full research dashboard.